Use the Gaussian Filter Function
You can use the Gaussian Filter function to calculate a smoothed value for each point by considering its adjacent data points.
It is factored by a simple Gaussian digital filter, which depends on the distance from the mean, ensuring a natural weighting of surrounding values.
Understanding Gaussian Function
The following information describes this function:
- Calculates the mean, standard deviation, and variance of a set of values within a specific window.
- Determines a coefficient using the formula 1 / (sqrt(2 * PI) * deviation)
- Computes the exponential part with exp(-1/2 * ((current - mean) / deviation)^2)
- The Gaussian Function is derived by multiplying the coefficient with the exponential part.
- The process results in a filtered value that smooths or blurs the original data, applying a natural weight based on proximity to the mean.
User Scenario
Review the following scenario for the Gaussian Filter function. Then, you will simulate PLC data and calculate the filtered values.
In a precision manufacturing facility specializing in aerospace components, high-resolution cameras are employed to inspect the surface of parts for microscopic flaws. These inspections generate vast amounts of image data, where even the smallest imperfection can signal a potential failure in critical aerospace systems.
We apply the Gaussian Filter function to images to reduce noise and lighting changes that can hide defects. This helps the inspection algorithms to find any problems with a component.
Step 1: Add a Device
Follow the steps to Connect a Device and configure the following parameters:
- Device Type: Simulator
- Driver Name: Generator
- Enable Alias Topics: Select the checkbox.
Step 2: Add Tags
After connecting the device, add the following tag. See Add Tags to learn more.
Tag 1: input1
- Name: Select S - Random value generator
- Value Type: Select float64
- Polling Interval: Enter 1
- Tag Name: Enter input1
- Min_value: Enter 101
- Max_value: Enter 199
Step 3: Create Analytics Flows
You can now create the analytics flows using data from the device and tag you previously created.
To create an analytics flow with the Gaussian Filter Processor function:
- In Litmus Edge, navigate to Analytics.
On the analytics canvas, click Add processor. The Create a processor dialog box displays.
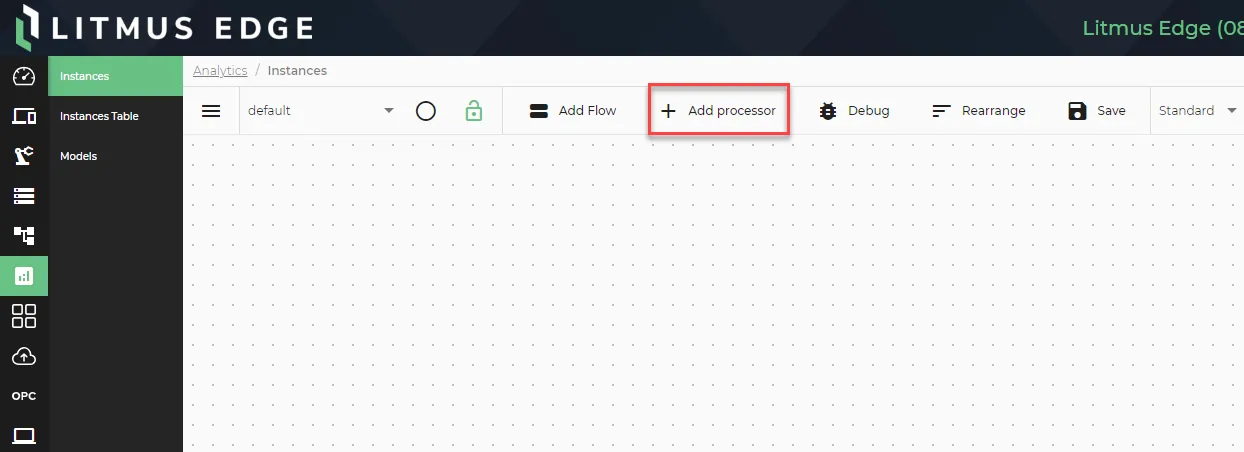 The Add processor option
- Select DataHub Subscribe.
In the Topic field, click the Search icon, select the device you previously created, and then select the alias topic for the input1 tag.
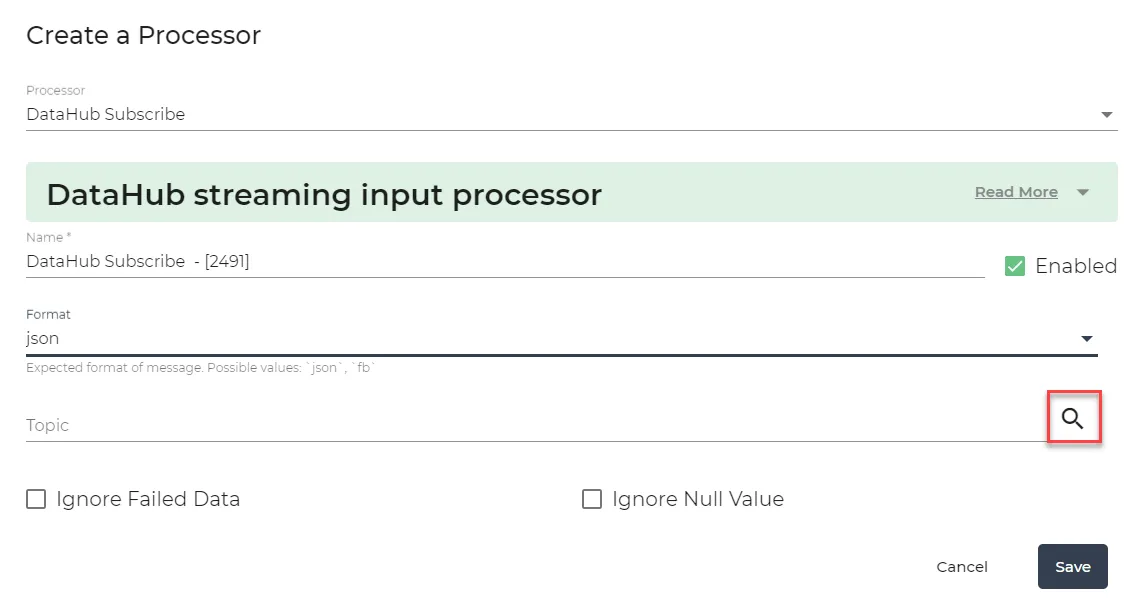 Create a Processor dialog box
- Click Save.
- Click Add processor again and select the Gaussian Filter processor. The Edit a Processor dialog box appears.
- Window Size: Enter a value that represents the range to apply the gaussian digital function. For this example, we input a value of 30.
- Number of Deviations: Number of deviations to use for the calculations. For this example, we input a value of 1.
- TimeInterval: If you know your input is going to publish at the expected interval, it is better to disable this timer by entering 0 in the field.
Click Save.
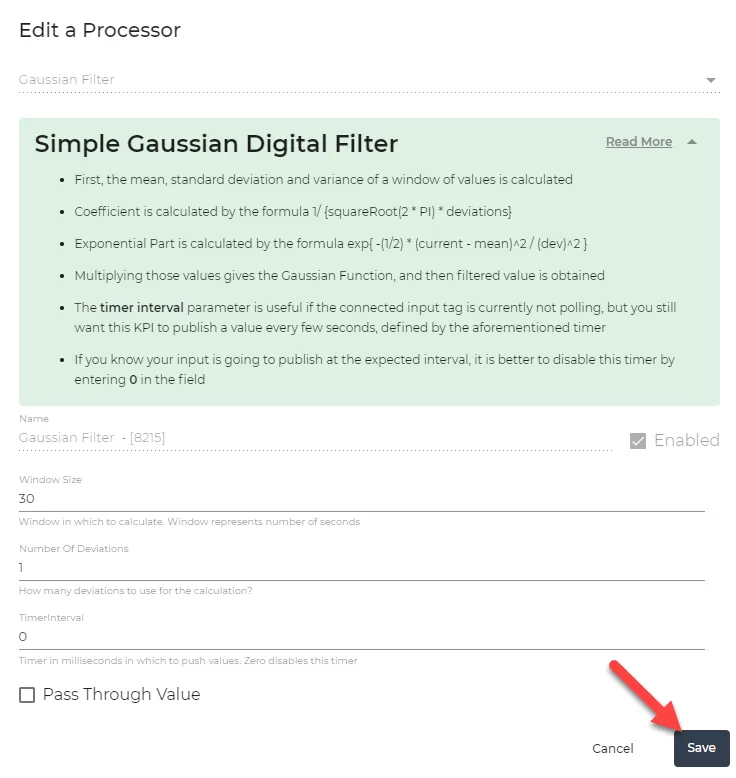 Edit a Processor dialog box
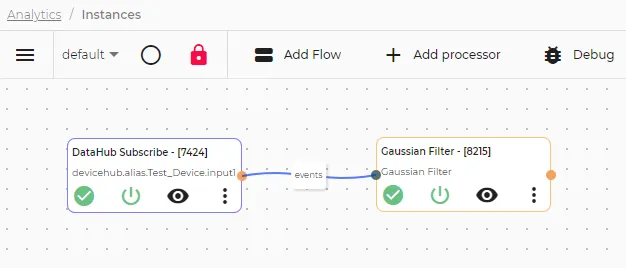
- Connect the DataHub Subscribe processor (tag: input1) to the Gaussian Filter processor with a wire and use the events connection.
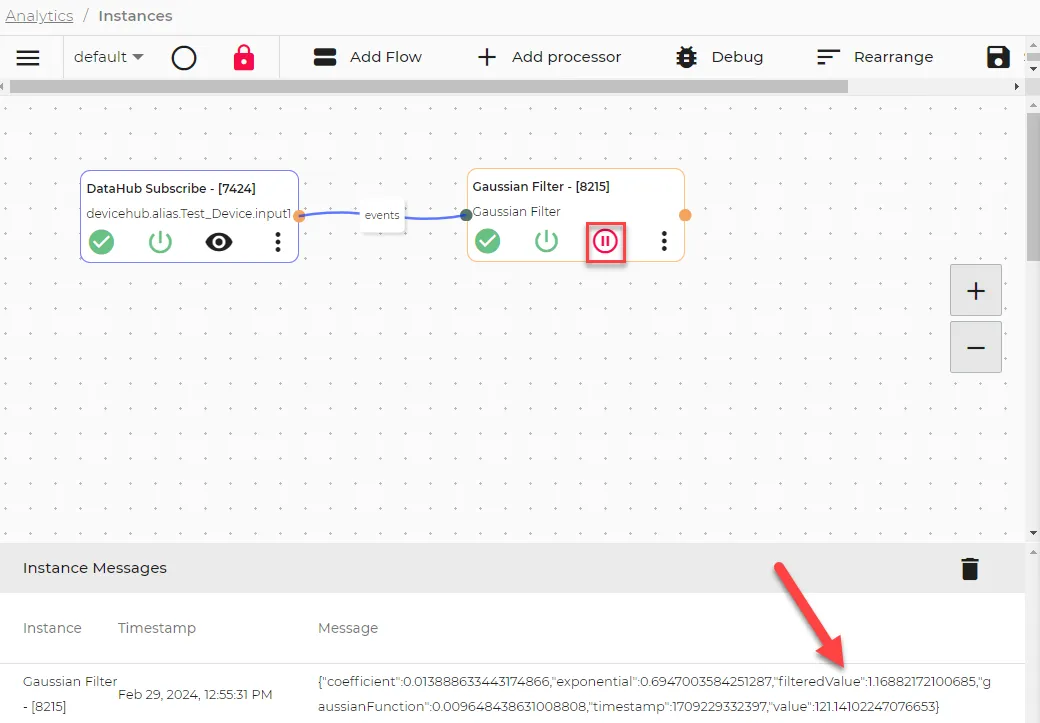
- On the analytics canvas, click Save. The configured analytics flows should look like the following:
Step 4: View Output of Processor
Click the View icon in the Gaussian Filter processor to view the output values.
The Gaussian Filter output yielded a filtered value of 1.16882172100685 with a coefficient of 0.013888633443174866 and exponential of 0.6947003584251287.