Use the Linear Prediction Function
You can use the Linear Prediction function to forecast future data points by fitting a linear equation to collected data and using statistical techniques to identify the underlying trend.
User Scenario
Review the following scenario for the linear prediction processor function. Then, using an input processor, you will simulate PLC data and predict future data from the window of generated values.
In a steel production facility, the temperature within the blast furnace is a critical parameter that determines the quality of the produced steel. Operators use the Linear Prediction function to forecast the temperature trends based on past readings. By fitting a linear model to the historical temperature data collected from sensors, the function helps predict potential overheating or cooling, which could lead to suboptimal steel quality.
Step 1: Add a Device
Follow the steps to Connect a Device and configure the following parameters:
- Device Type: Simulator
- Driver Name: Generator
- Enable Alias Topics: Select the checkbox.
Step 2: Add Tags
After connecting the device, add the following tag. See Add Tags to learn more.
Tag 1: input1
- Name: Select S - Random value generator
- Value Type: Select float64
- Polling Interval: Enter 1
- Tag Name: Enter input1
- Min_value: Enter 1
- Max_value: Enter 25
Step 3: Create Analytics Flows
You can now create the analytics flows using data from the device and tag you previously created.
To create an analytics flow with the Linear Prediction Processor function:
- In Litmus Edge, navigate to Analytics.
On the analytics canvas, click Add processor. The Create a processor dialog box displays.
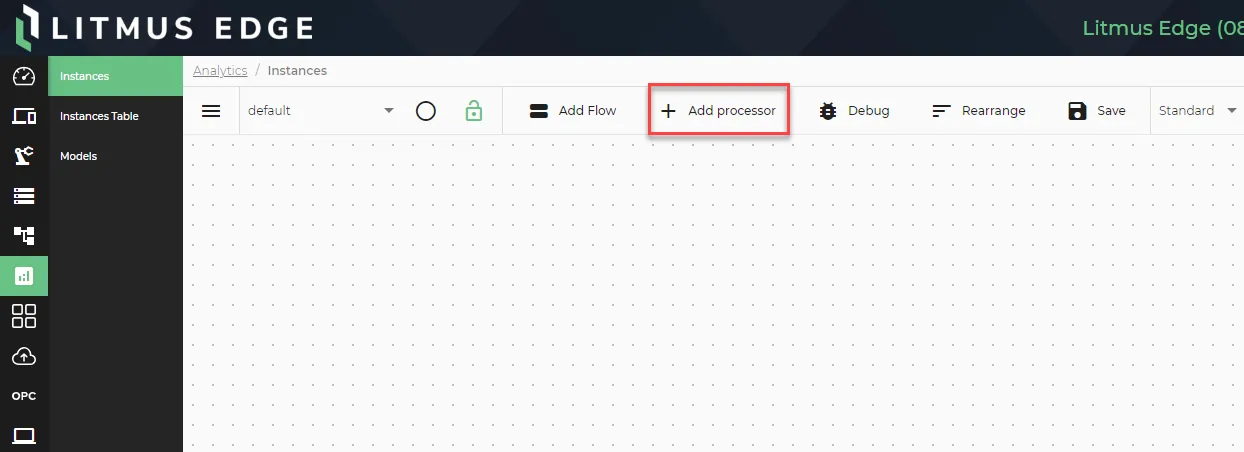 The Add processor option
- Select DataHub Subscribe.
In the Topic field, click the Search icon, select the device you previously created, and then select the alias topic for the input1 tag.
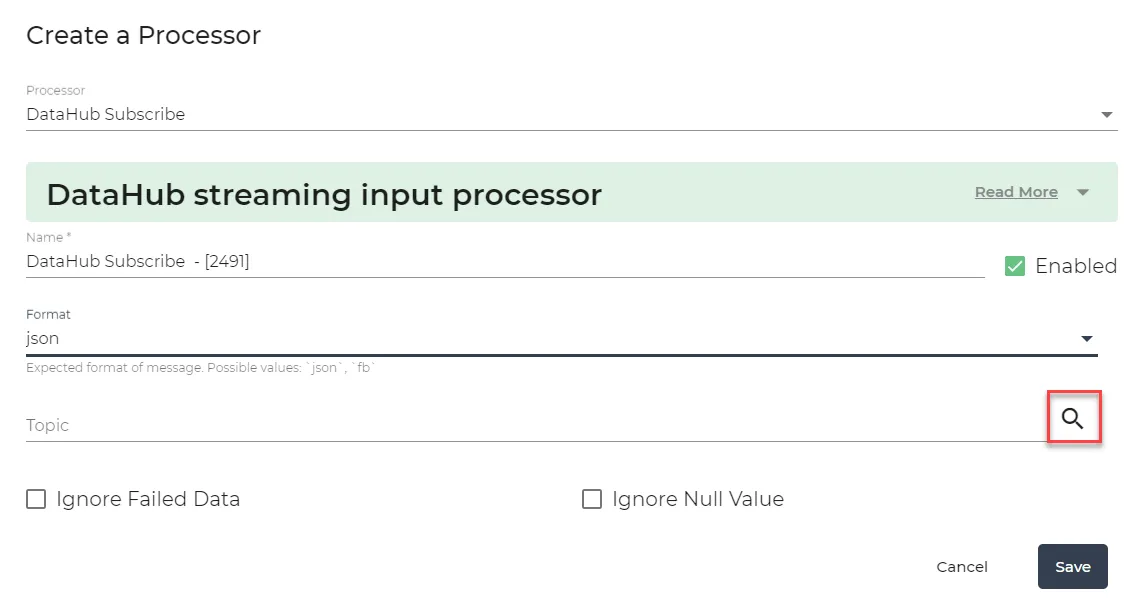 Create a Processor dialog box
- Click Save.
- Click Add processor again and select the Linear Prediction processor. The following information defines this function:
- Window Size: Enter a value that represents the range to observe before making each prediction. For this example, we input a value of 60.
- Number of Predictions: Enter a value to determine how many predictions you want. For this example, we input a value of 2.
- Polling Interval: Enter the interval in seconds at which you want to publish the data from the input tag. For this example, we input a value of 1.
- TimeInterval: If you know your input is going to publish at the expected interval, it is better to disable this timer by entering 0 in the field.
Click Save.
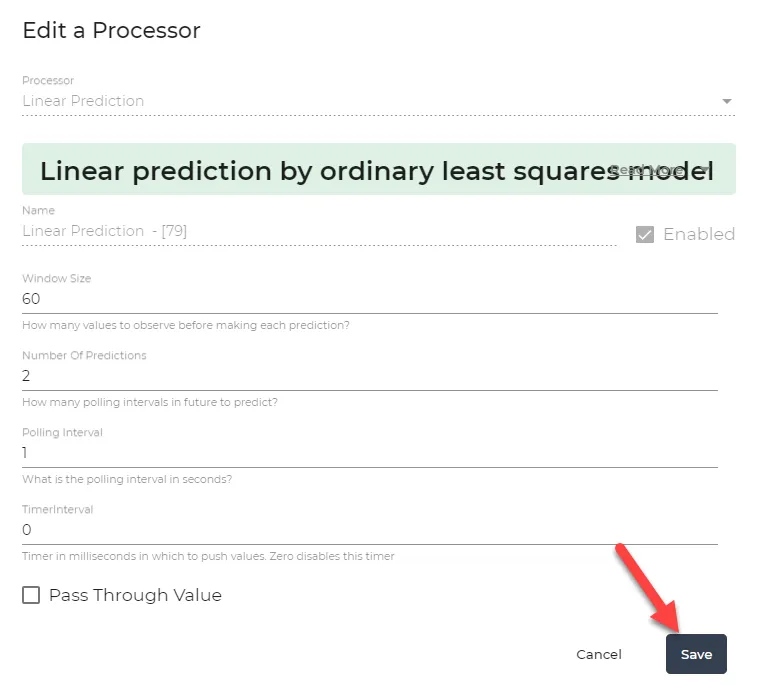 Edit a Processor dialog box
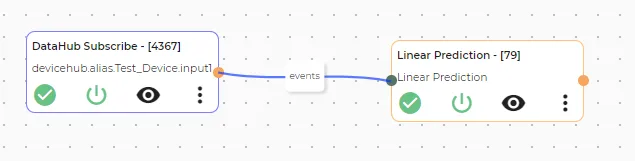
- Connect the DataHub Subscribe processor (tag: input1) to the Linear Prediction processor with a wire and use the events connection.
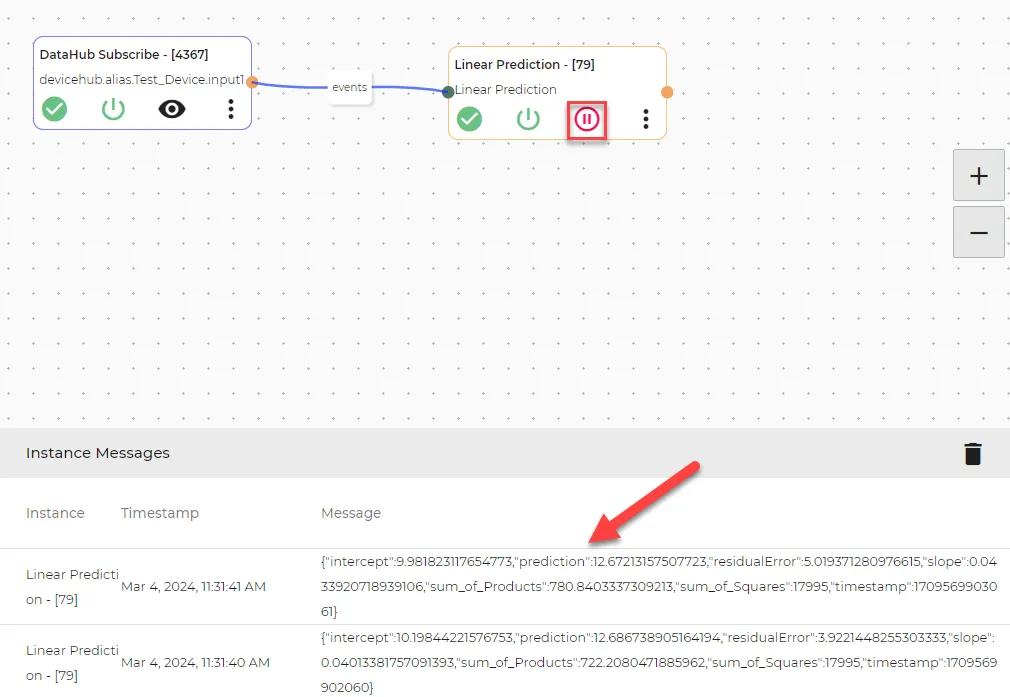
- On the analytics canvas, click Save. The configured analytics flows should look like the following:
Step 4: View Output of Processor
Click the View icon in the Linear Prediction processor to view the output values.
The prediction is made by extrapolating the number of predictions in the simple formula y = m*X + b.
The output indicates a linear prediction with an intercept of 9.89, a slope of 0.0434, and a prediction value of 12.68.