Use the Normalization Processor Function
You can use the Normalization processor function to eliminate redundant data and ensure that collected PLC data is on the same scale. Normalization also eliminates undesirable characteristics like Insertion, Update, and Deletion Anomalies. The value range is observed, and the next value is normalized to a range between 0 and 1 based on the chosen method. The values use a moving window algorithm and are placed between 0 and 1 based on the previous window.
Understanding Different Normalization Types
You have the following normalization types:
- Min-Max: Scale the data points between minimum and maximum values in that window. This will ensure that all the transformed values fall between 0 and 1.
- Average Standard Deviation: Standardize features in the moving window by subtracting the mean and dividing by the standard deviation. This results in features with an average of zero and a variance of one.
User Scenario
Review the following scenario for the normalization processor function. Then, you will simulate PLC data and normalization outputs using an input processor.
PLC sensors in a beverage bottling plant monitor variables like liquid temperature, fill level, and bottle placement speed. Applying the normalization function to these readings will help to scale the data points within a 0-1 range for each batch. This uniform scaling is crucial for the machine learning model used in quality control, as it compares current production metrics with historical data to detect and rectify any deviations, ensuring consistent product quality and optimal production efficiency.
Step 1: Add a Device
Follow the steps to Connect a Device and configure the following parameters:
- Device Type: Simulator
- Driver Name: Generator
- Enable Alias Topics: Select the checkbox.
Step 2: Add Tags
After connecting the device, add the following tags. See Add Tags to learn more.
Tag 1: tag1
- Name: Select S - Random value generator
- Value Type: Select float64
- Polling Interval: Enter 5
- Tag Name: Enter tag1
- Min_value: Enter 101
- Max_value: Enter 199
Step 3: Create Analytics Flows
You can now create the analytics flows using data from the device and tag you previously created. Follow the appropriate step out of 3a or 3b based on the two normalization types you want to use.
To create an analytics flow with the Normalization Processor function:
- Navigate to Analytics.
On the analytics canvas, click Add processor. The Create a processor dialog box displays.
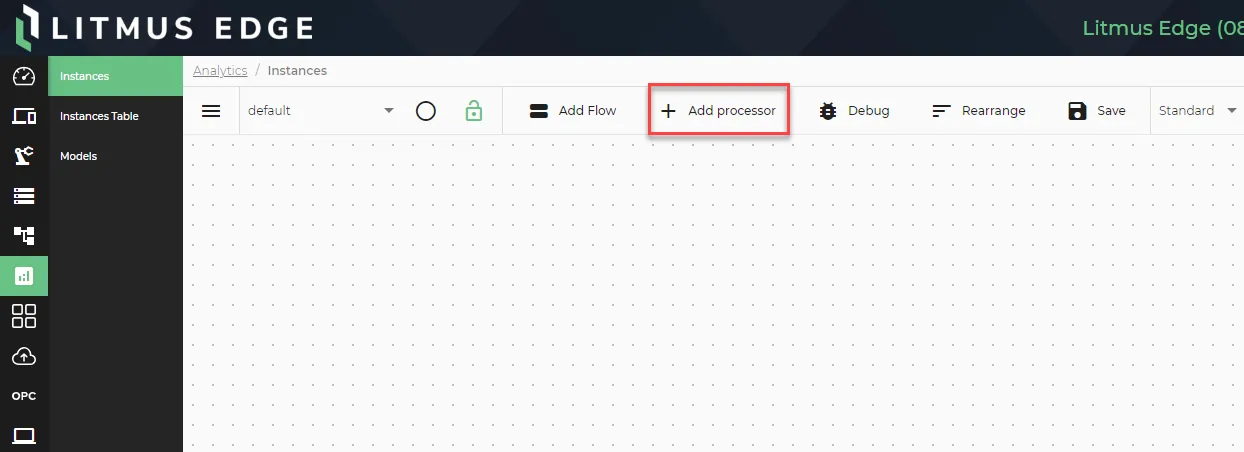 The Add processor option
- Select DataHub Subscribe.
In the Topic field, click the Search icon, select the device you previously created, and then select the alias topic for the tag1.
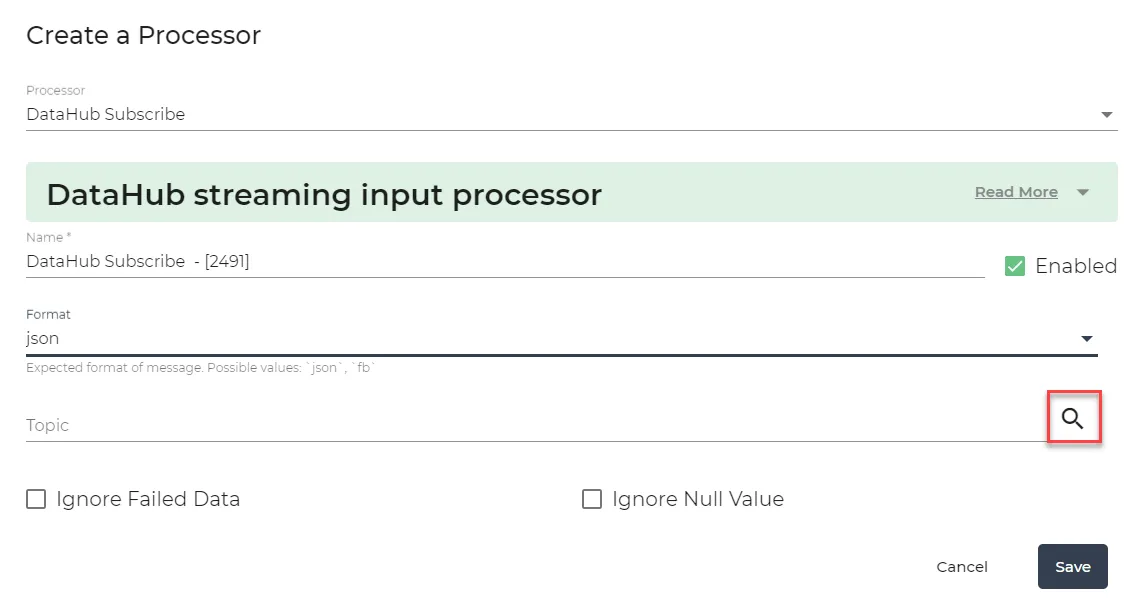 Create a Processor dialog box
- Click Save.
Step 3a: Configure Min-Max Normalization
- Click Add processor again and select Normalization processor. The following information defines this function:
- Mode: Select the Min-Max normalization type from the drop-down menu.
- Window Size: Enter the number of values you want the function to consider.
Click Save.
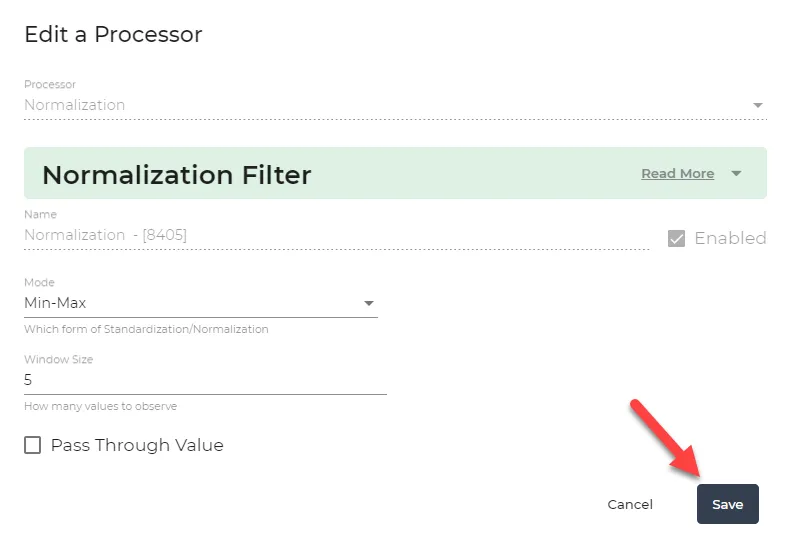 Normalization dialog box
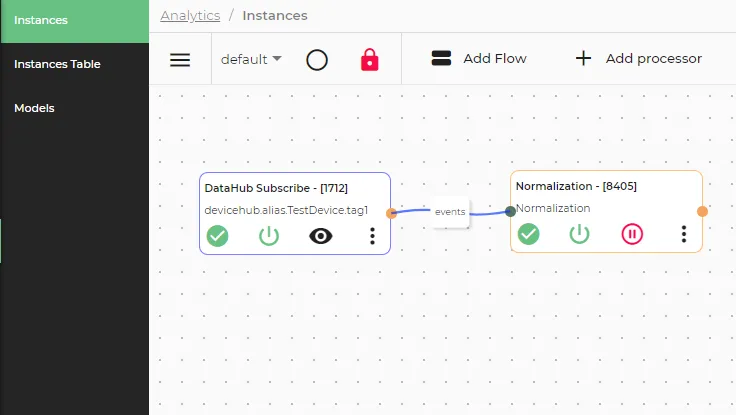
- Connect the DataHub Subscribe processor (tag: tag1) to the Normalization processor with a wire and use the events connection.
- On the analytics canvas, click Save.
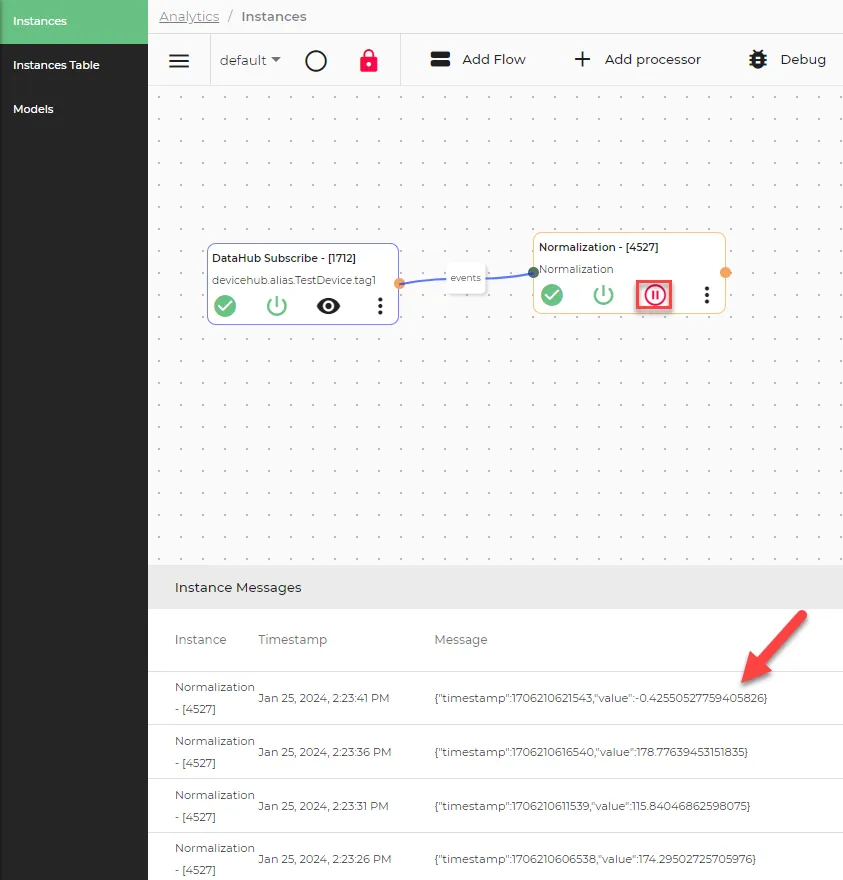
The configured analytics flows should look like the following:
Step 3b: Configure Average-Standard Deviation Normalization
- Click Add processor again and select Normalization processor. The following information defines this function:
- Mode: Select the Average-Standard Deviation normalization type from the drop-down menu.
- Window Size: Enter the number of values you want the function to consider.
Click Save.
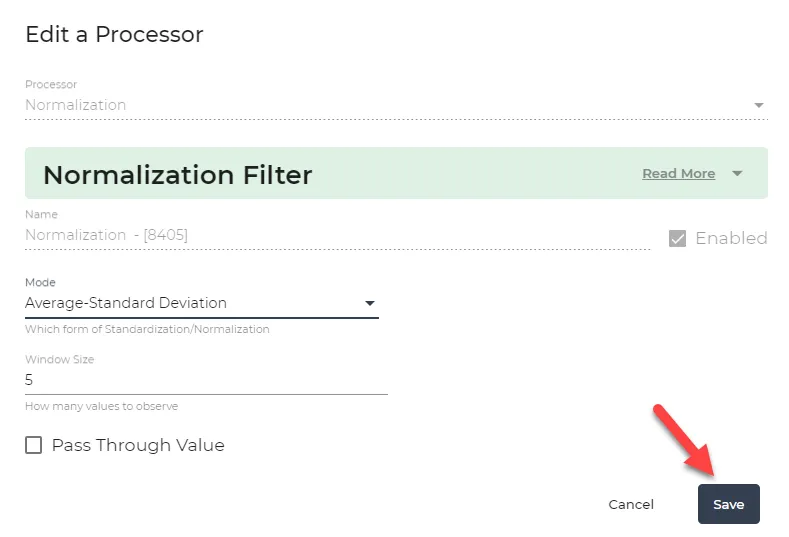 Normalization dialog box
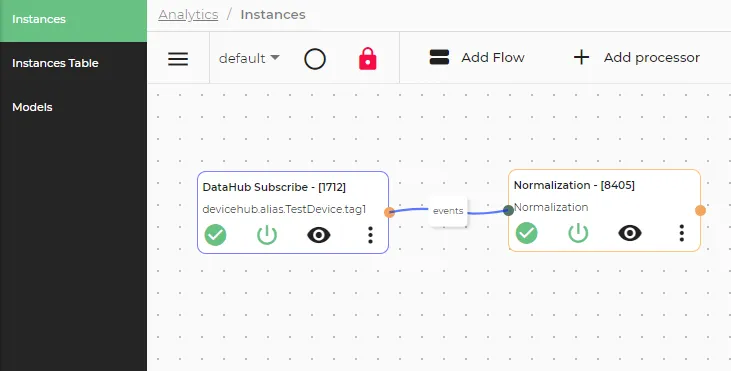
- Connect the DataHub Subscribe processor (tag: tag1) to the Normalization processor with a wire and use the events connection.
- On the analytics canvas, click Save.
The configured analytics flows should look like the following:
Step 4: View Output of Processor
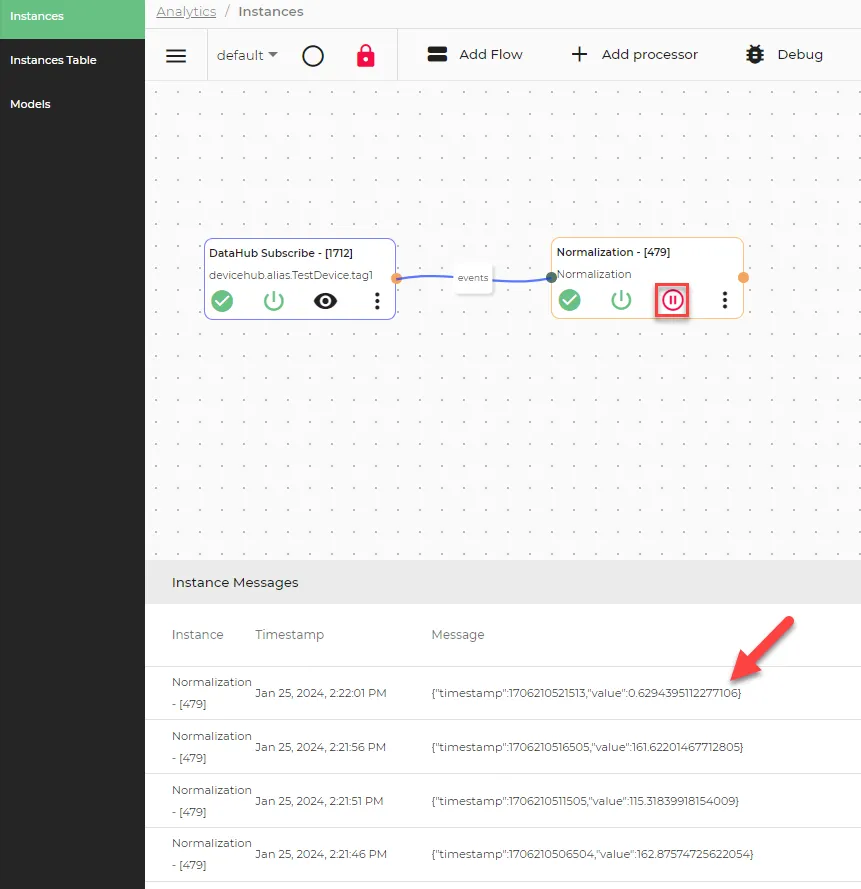
Click the View icon in the Normalization processor to view the output values.
View Min-Max Normalization Output
The normalization function normalizes the last 5 values from the defined tag1, and the next value is again placed between 0 and 1 based on the previous window.
View Average-Standard Deviation Normalization Output
The normalization function normalizes the last 5 values from the defined tag1, and the next value is again placed between 0 and 1 based on the previous window.