Use the Rise and Fall Function
You can use the Rise and Fall function to calculate the difference in upper and lower thresholds between consecutive values from the PLCs.
Understanding Different Rise and Fall Functions
Use one of the following functions for your inputs:
- Rise: Once you enter a lower and upper threshold, this function will show you the timestamp at which the current value starts to rise from the upper threshold.
- Fall: Once you enter a lower and upper threshold, this function will show you the timestamp at which the current value starts to fall from the lower threshold.
- RiseAndFall: Once you enter a lower and upper threshold, this function will show you the timestamp at which the current value starts to rise from the upper threshold and fall from the lower threshold.
User Scenario
Review the following scenario for the rise and fall processor function. Then, you will simulate PLC data and calculate KPIs using a single input processor function.
Suppose you are monitoring a manufacturing process where a motor's temperature is being recorded by a PLC. You want to know when the temperature rises above 80 degrees Celsius and when it falls below 70 degrees Celsius. Using the RiseAndFall function with the appropriate thresholds, you can get the exact timestamps when the temperature rises above 80 degrees and falls below 70 degrees. This information can help you optimize the process and prevent any potential issues.
Step 1: Add a Device
Follow the steps to Connect a Device and configure the following parameters:
- Device Type: Simulator
- Driver Name: Generator
- Enable Alias Topics: Select the checkbox.
Step 2: Add Tags
After connecting the device, add the following tag. See Add Tags to learn more.
Tag 1: temperature
- Name: Select S - Random value generator
- Value Type: Select float64
- Polling Interval: Enter 5
- Tag Name: Enter temperature
- Min_value: Enter 60
- Max_value: Enter 90
Step 3: Create Analytics Flows
You can now create the analytics flows using data from the device and tag you previously created.
To create an analytics flow with the Rise and Fall function:
- Navigate to Analytics.
On the analytics canvas, click Add processor. The Create a processor dialog box displays.
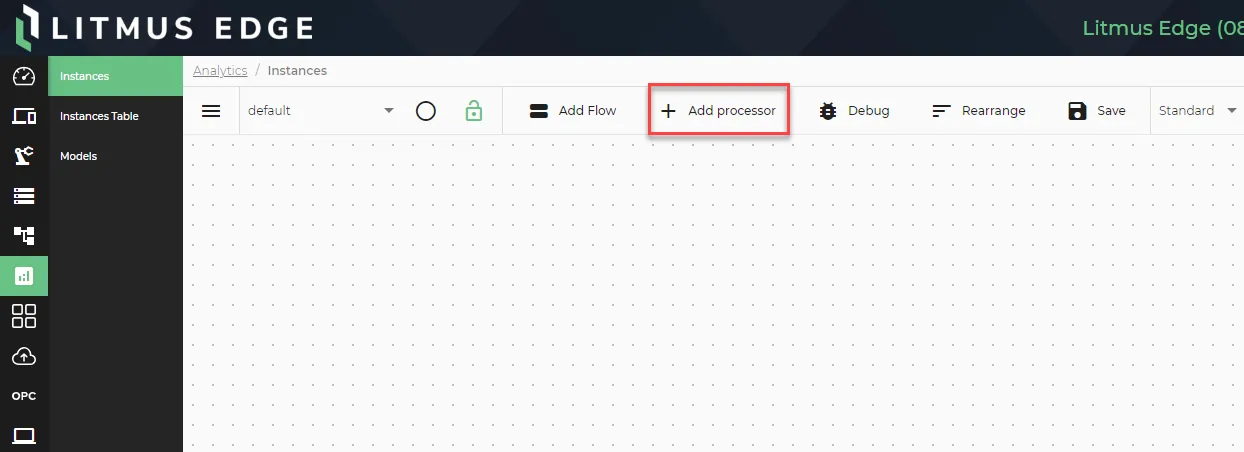 The Add processor option
- Select DataHub Subscribe.
In the Topic field, click the Search icon, select the device you previously created, and then select the alias topic for the temperature.
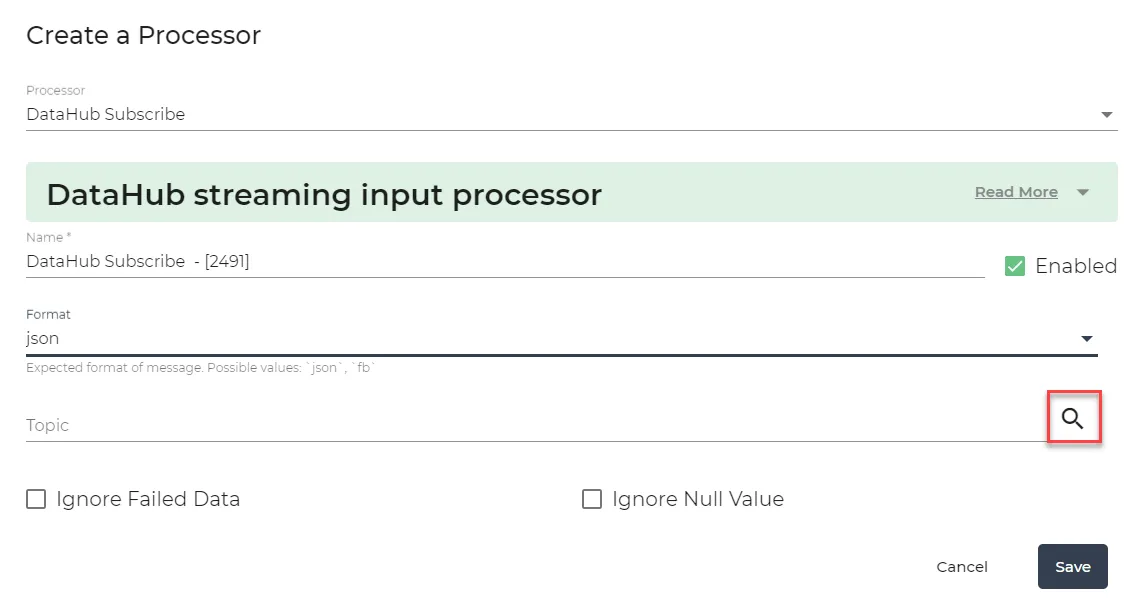 Create a Processor dialog box
- Click Save.
Step 3a: Configure rise KPI
- Click Add processor again and select Rise and Fall processor. The following information defines this function:v
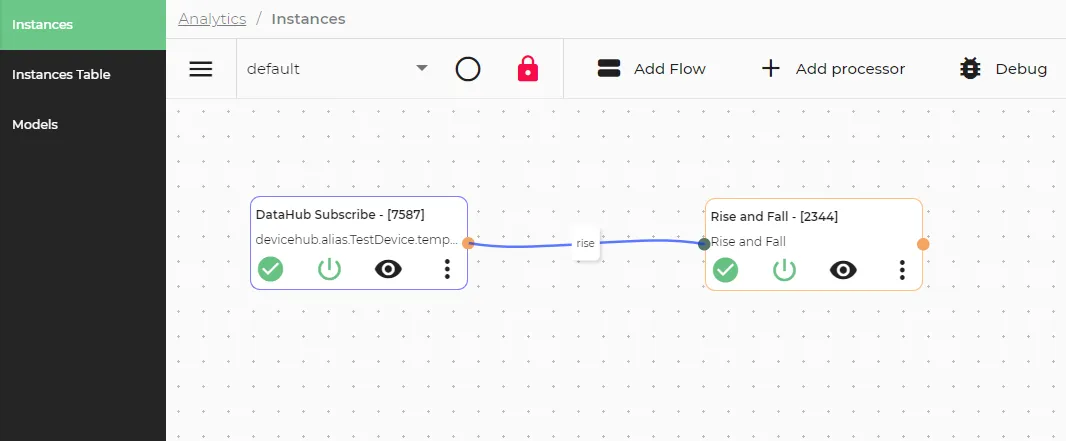
- KPI: Select rise.
- Tolerance: Enter a value to determine the range of values considered acceptable.
- Upper: Enter 80 for upper threshold value.
- Lower: Enter 70 for lower threshold value.
Click Save.
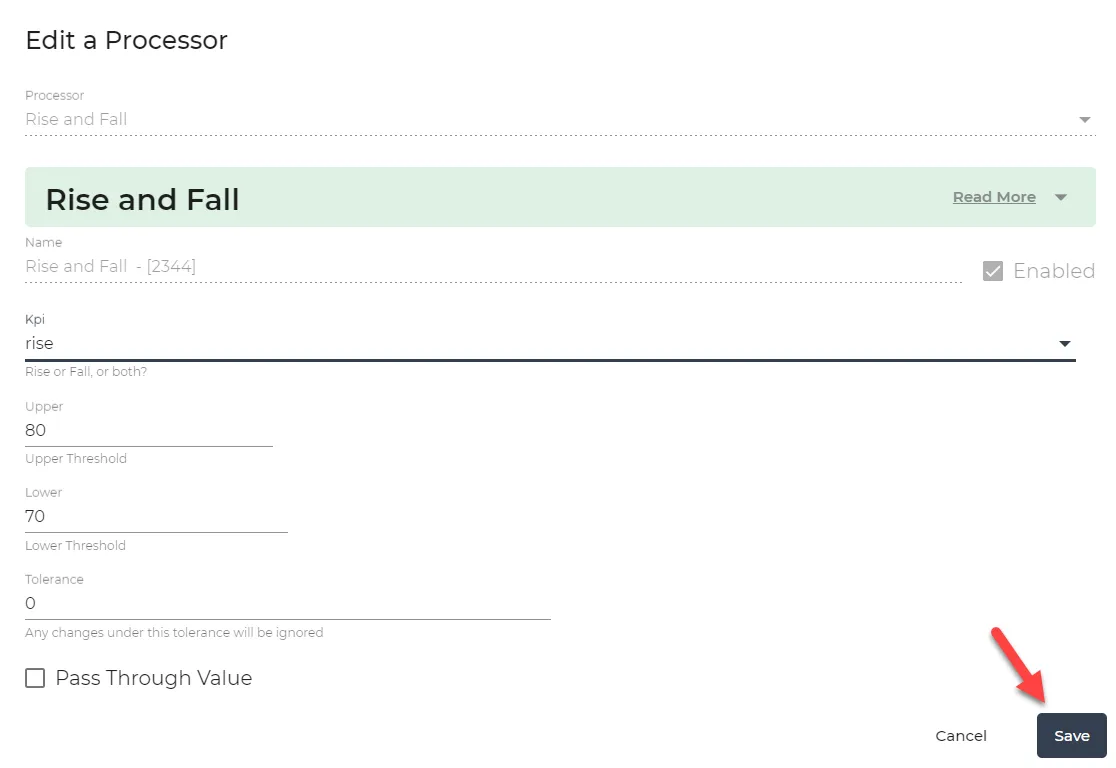 rise and fall dialog box
- Connect the DataHub Subscribe processor (tag: temperature) to the Rise and Fall processor with a wire and use the events connection.
- On the analytics canvas, click Save.
The configured analytics flows should look like the following:
Step 3b: Configure fall KPI
- Click Add processor again and select Rise and Fall processor. The following information defines this function:
- KPI: Select fall.
- Tolerance: Enter a value to determine the range of values considered acceptable.
- Upper: Enter 80 for upper threshold value.
- Lower: Enter 70 for lower threshold value.
Click Save.
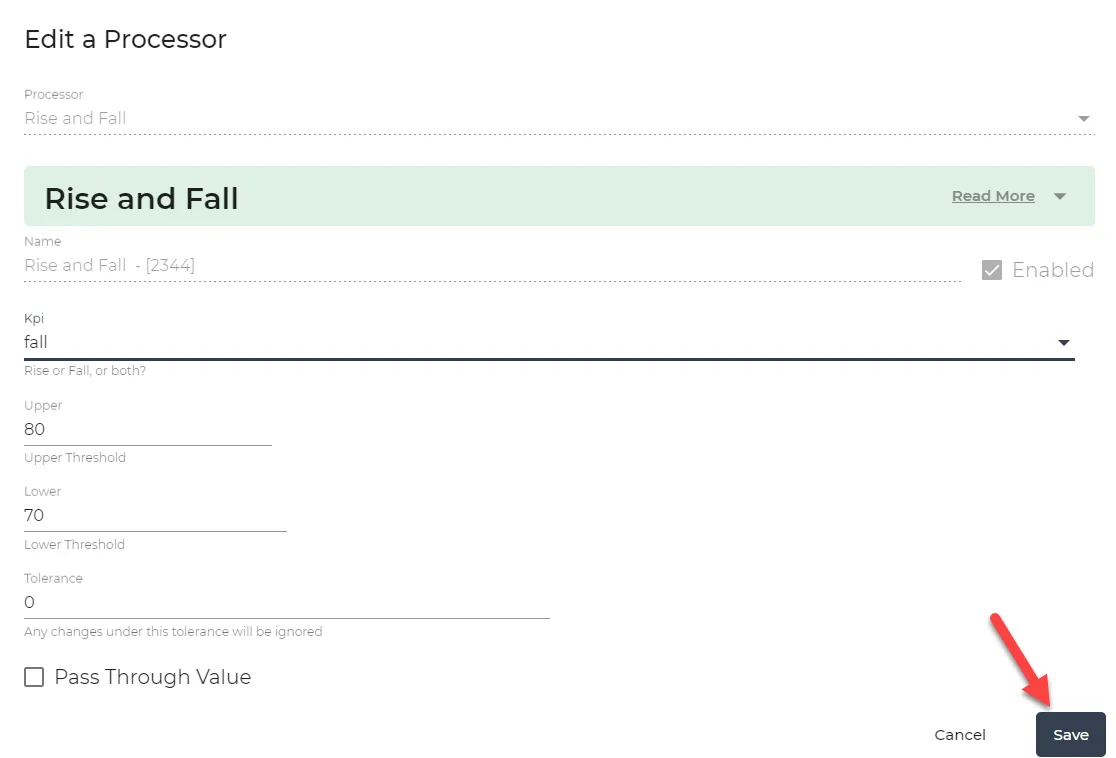 rise and fall dialog box
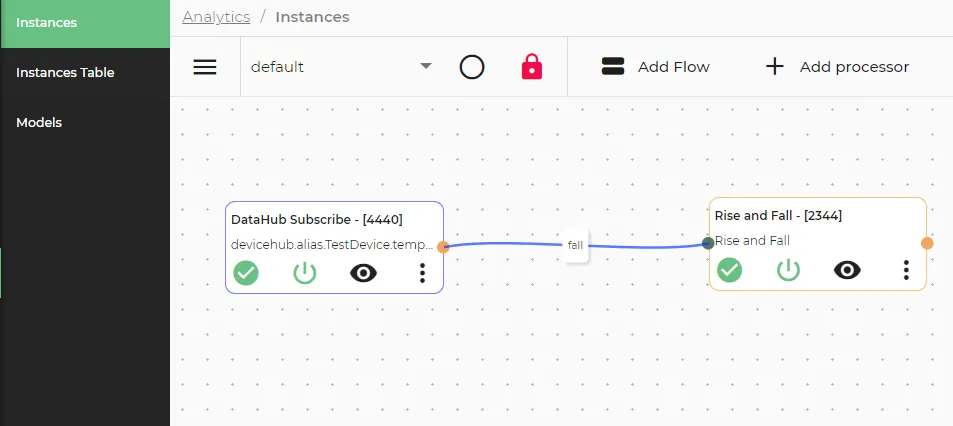
- Connect the DataHub Subscribe processor (tag: temperature) to the Rise and Fall processor with a wire and use the events connection.
- On the analytics canvas, click Save.
The configured analytics flows should look like the following:
Step 3c: Configure riseAndFall KPI
- Click Add processor again and select Rise and Fall processor. The following information defines this function:v
- KPI: Select riseAndFall.
- Tolerance: Enter a value to determine the range of values considered acceptable.
- Upper: Enter 80 for upper threshold value.
- Lower: Enter 70 for lower threshold value.
Click Save.
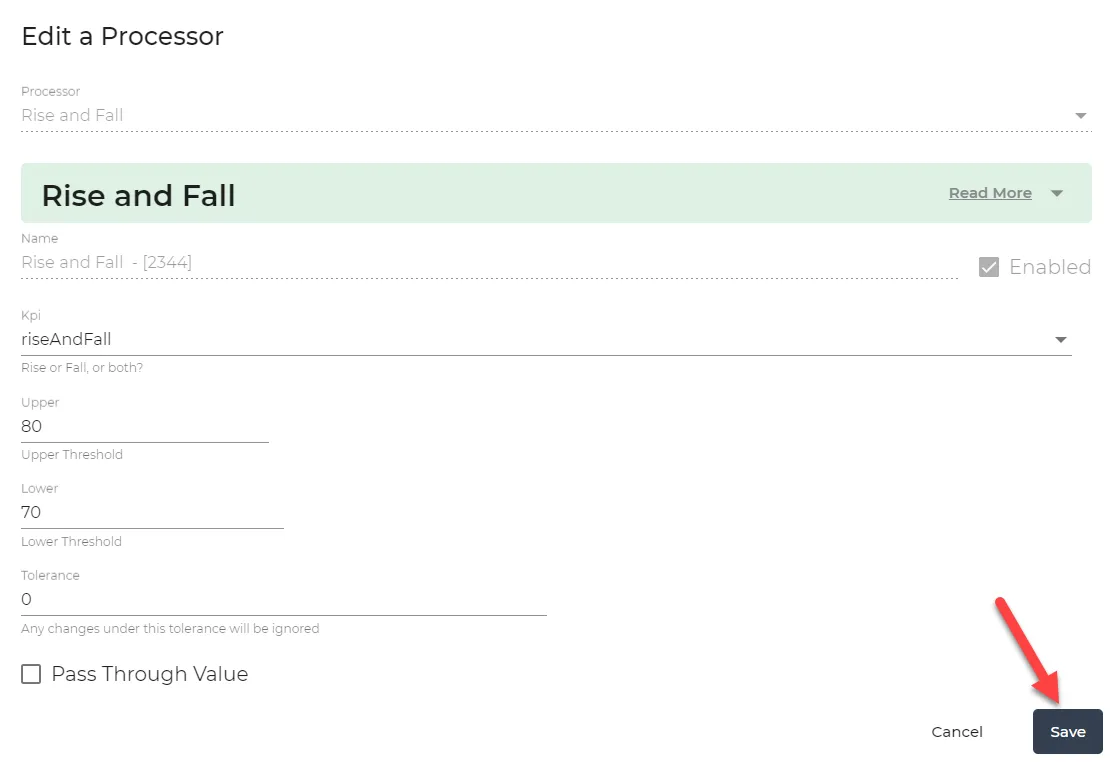 rise and fall dialog box
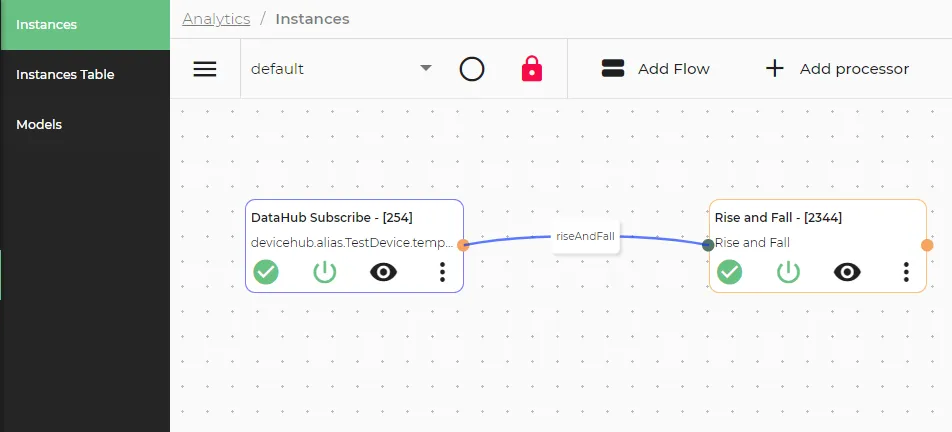
- Connect the DataHub Subscribe processor (tag: temperature) to the Rise and Fall processor with a wire and use the events connection.
- On the analytics canvas, click Save.
The configured analytics flows should look like the following:
Step 4: View Output of Processor
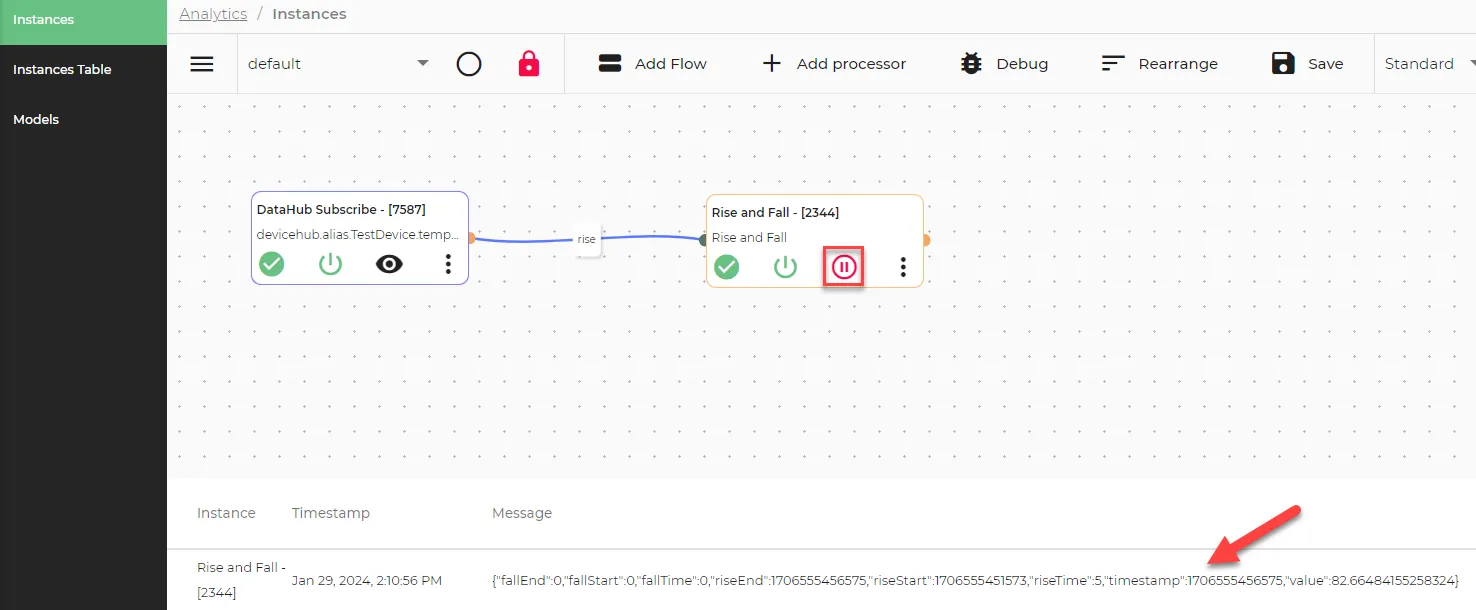
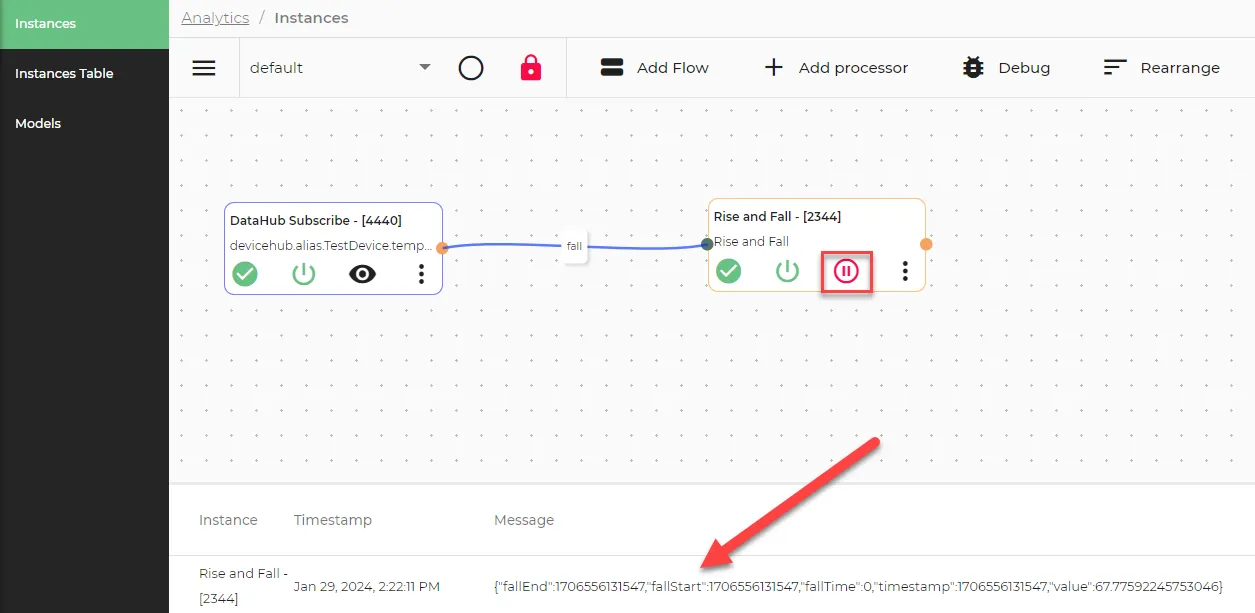
Click the View icon in the Rise and Fall processor to view the output values.
View rise KPI Output
As the generated value is 82.664, which is more than the upper threshold, the output shows the riseEnd, riseStart and riseTime fields.
View fall KPI Output
As the generated value is 67.775, which is less than the lower threshold, the output shows the fallEnd, fallStart and fallTime fields.
View riseAndFall KPI Output
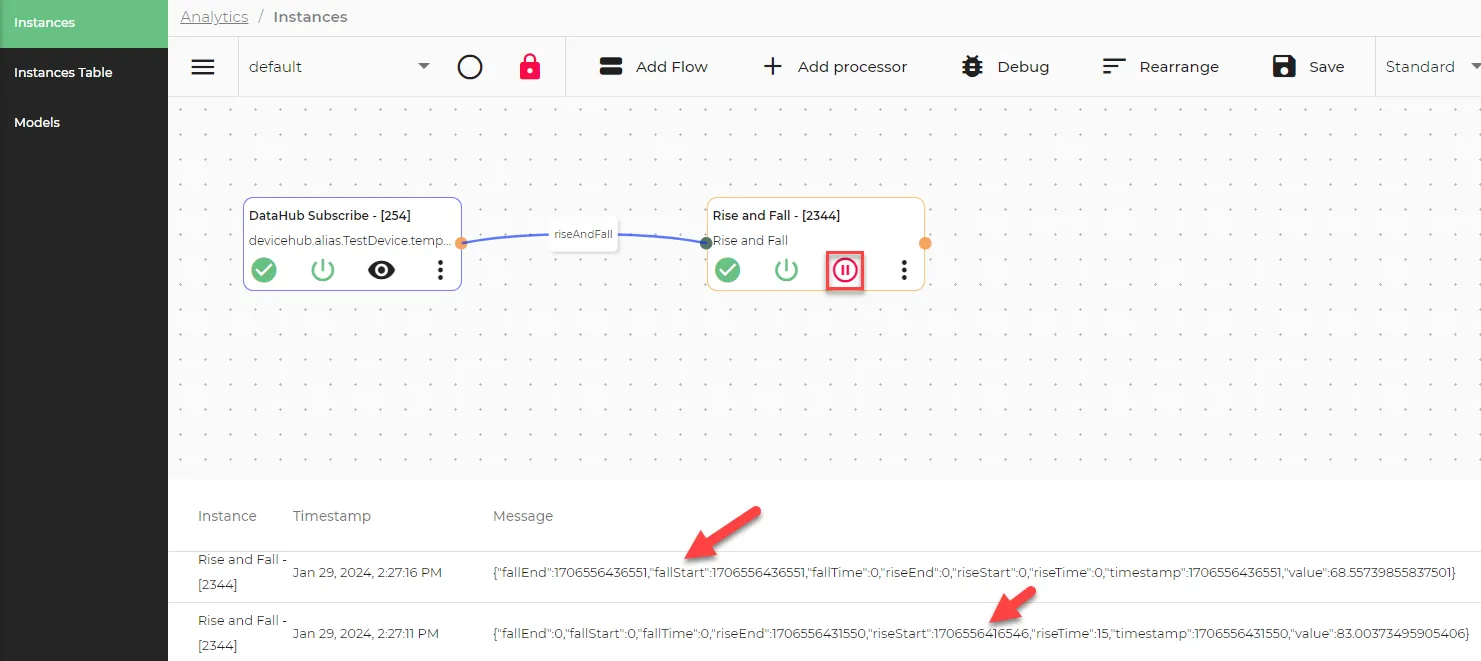
After generating values of 68.557 and 83.003, both falling outside the lower and upper thresholds, the corresponding fields are displayed.