Dashboard
The Dashboard gives you a real-time view of your Litmus Edge instance. The Dashboard displays system statistics, connected device and tag counts, message broker activity, and the health of running modules all in one place. This information is on the operational network and is completely offline.
Once you connect devices to Litmus Edge, you can use the Dashboard to monitor the overall health and activity of your system.

Dashboard Data
Action | Details |
|---|---|
[1] Device Time and Up Time | Device Time displays the time zone configured for the Litmus Edge instance. See Set Timezone. Up Time displays how long the instance has been running without a disconnection. |
[2] Devices & Tags | The number of connected devices and tags on your system. |
[3] Message Broker & Routing | Collected data is normalized or standardized and then published to the local message broker. This section displays the message rate of this process. |
[4] Data Processing & Analytics | The number of flows, analytics flows, and groups that are running. |
[5] Edge Applications | The number of installed applications. These applications are localized applications and containers. |
[6] Integrations | The total number of integrations and remotely connected networks. |
Dashboard Charts
The Dashboard includes preset charts that display system performance data over time. Hover your cursor horizontally over the charts to view data for additional dates.
CPU Utilization
Displays the usage of processing resources over time for the IUD Gateway, industrial PCs, all virtual machines, and the user.

Memory Load
Displays the memory usage for the system over time.

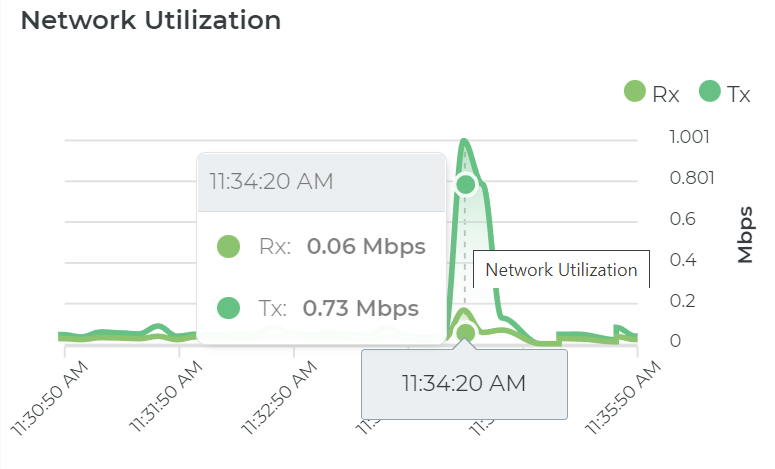
Network Utilization
Displays the received and transmitted network speed in MBPS (MegaBits Per Second) over time.
Module Status
At the bottom of the dashboard, status indicators show the health of the modules included in your plan. Hover over each indicator to see the module version. Each indicator displays a colored circle reflecting the online status of the selected module.

Color | Health |
|---|---|
Green | Services are up |
Red | Services are down |
Next to the indicators you can view your Storage utilization.
Considerations
- The Dashboard operates on the operational network and is completely offline.
- Charts display data for the last 5 minutes by default.
- The Dashboard becomes meaningful once you have connected devices and tags in DeviceHub.