Online Installation Digital Factory Demo
Online Installation Digital Factory Demo
Estimated time: 10 minutes
Overview
This guide covers deploying the Digital Factory Demo using online installation with Docker containers.
Setup Steps
1. Download Resources
Download the Docker Compose image and Litmus Edge template file from the Central Portal (marked with "online" flag).
2. Upload Containers
Upload containers for PLC simulators, MSSQL database, and Grafana dashboards.
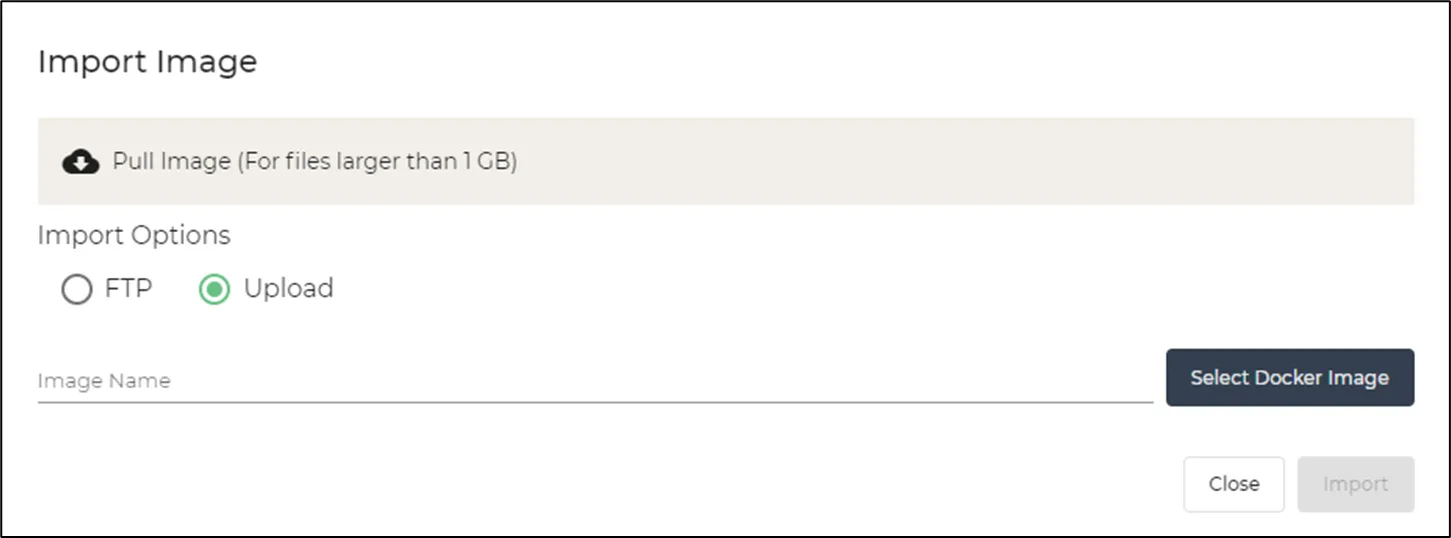
Upload the "litmus demo install tar" file under:
- Applications > Images > (+) > Upload > Select Docker image
Files and References
Download the docker-compose image and the Litmus Edge Template File from Central Portal marked with the "ONLINE" Flag.
Result should look as follows:

3. Install Containers
Navigate to Applications > Containers > Run and enter:
docker run -it -d --rm -v /var/run/docker.sock:/var/run/docker.sock \
-e HOST_IP="<your-ip>" litmus/demo-install litmus/demo-install
Allow 3-5 minutes (depending on bandwidth) for image pulls and stack startup.
Verify
After deploy, you should see five containers in LE:
simulation_servers
demo_mssql
demo_mysql
demo_grafana
template_applyer   (Exited 0 - this is correct)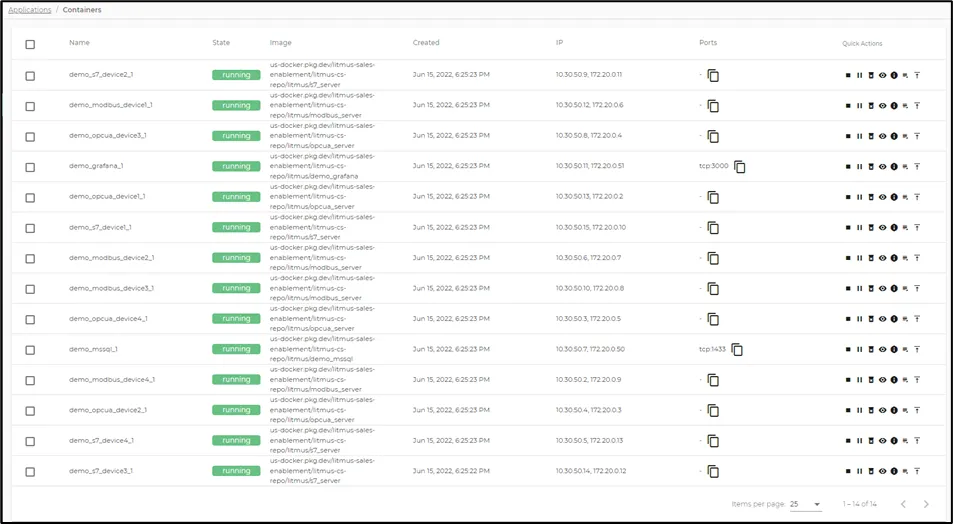
Upload Template
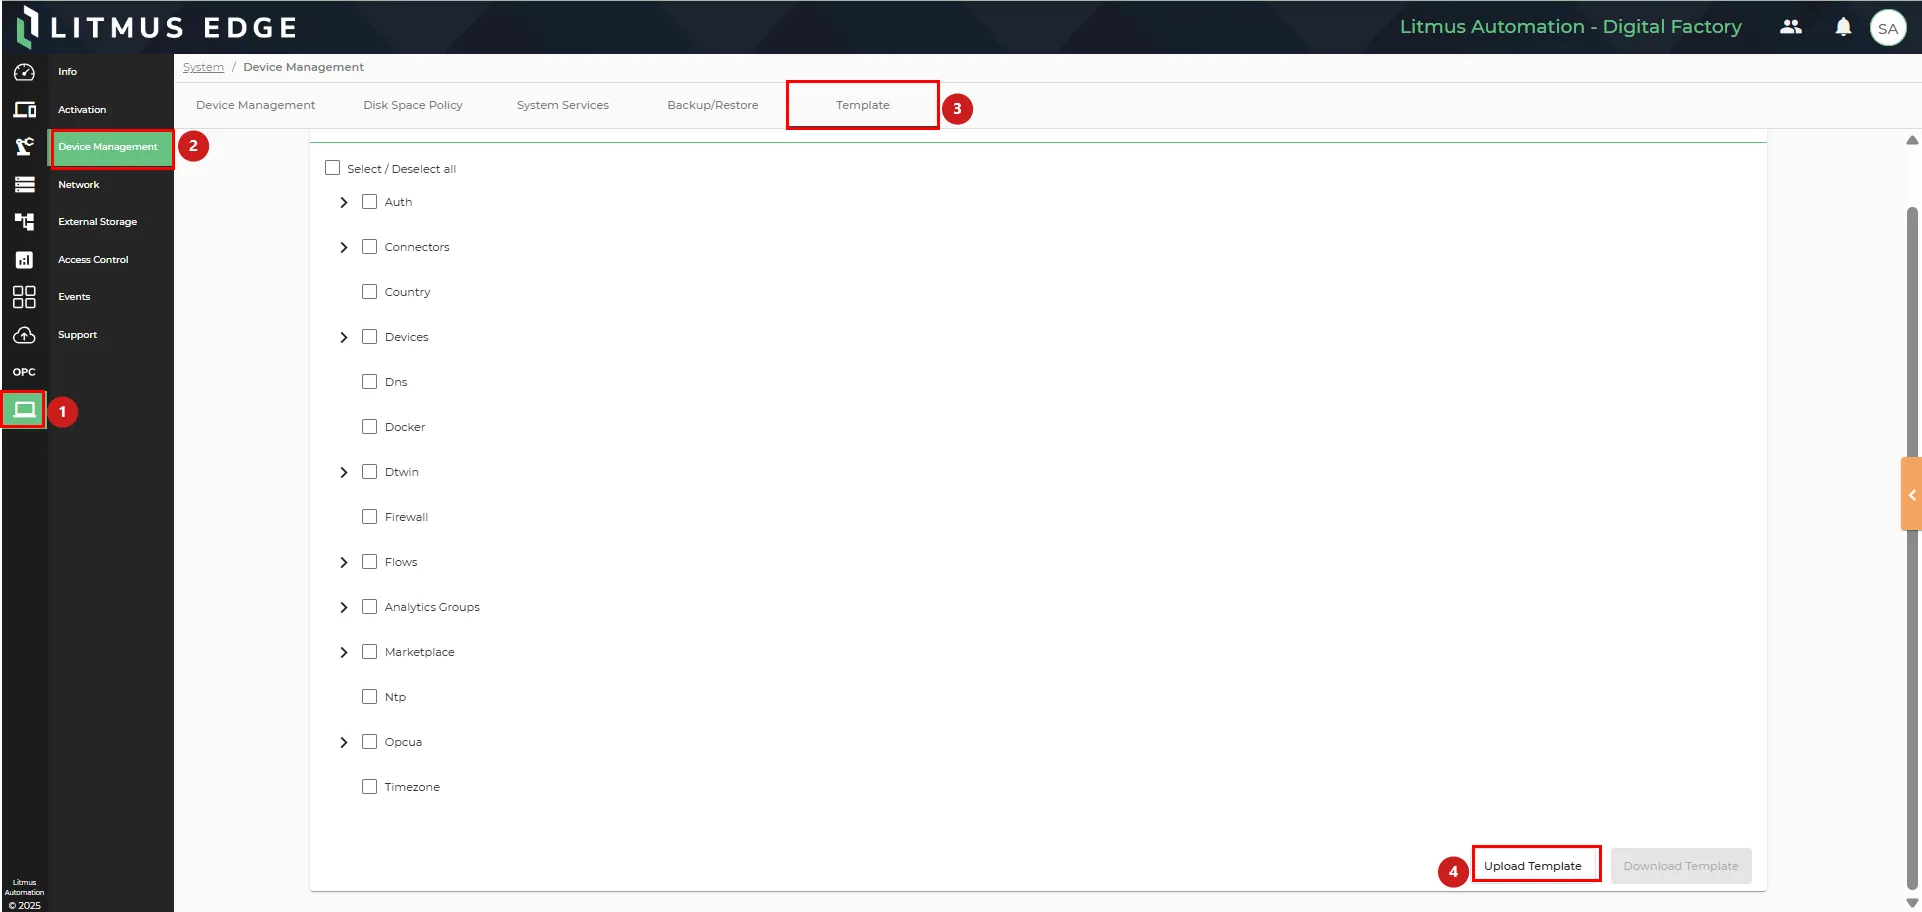
- Go to System > Device Management > Template > Upload Template.
- Upload the “Template.json” file.
Enable Data Store
NOTE: This step might be unnecessary with 3.11.0
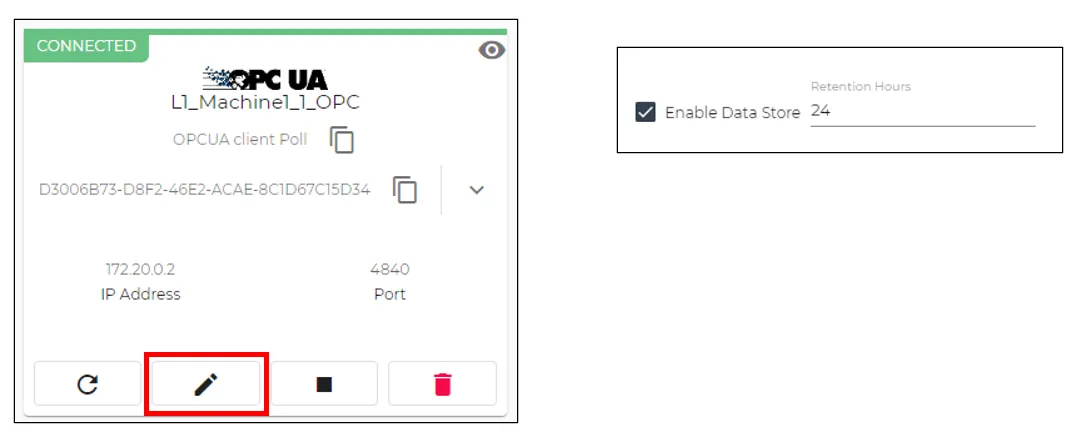
- Go to DeviceHub > Devices.
- Check the “Enable Data Store” and set to 24 (hours).
- Click on “Update Device”. Do this for all the devices (this is by design).
Authenticate Database Access
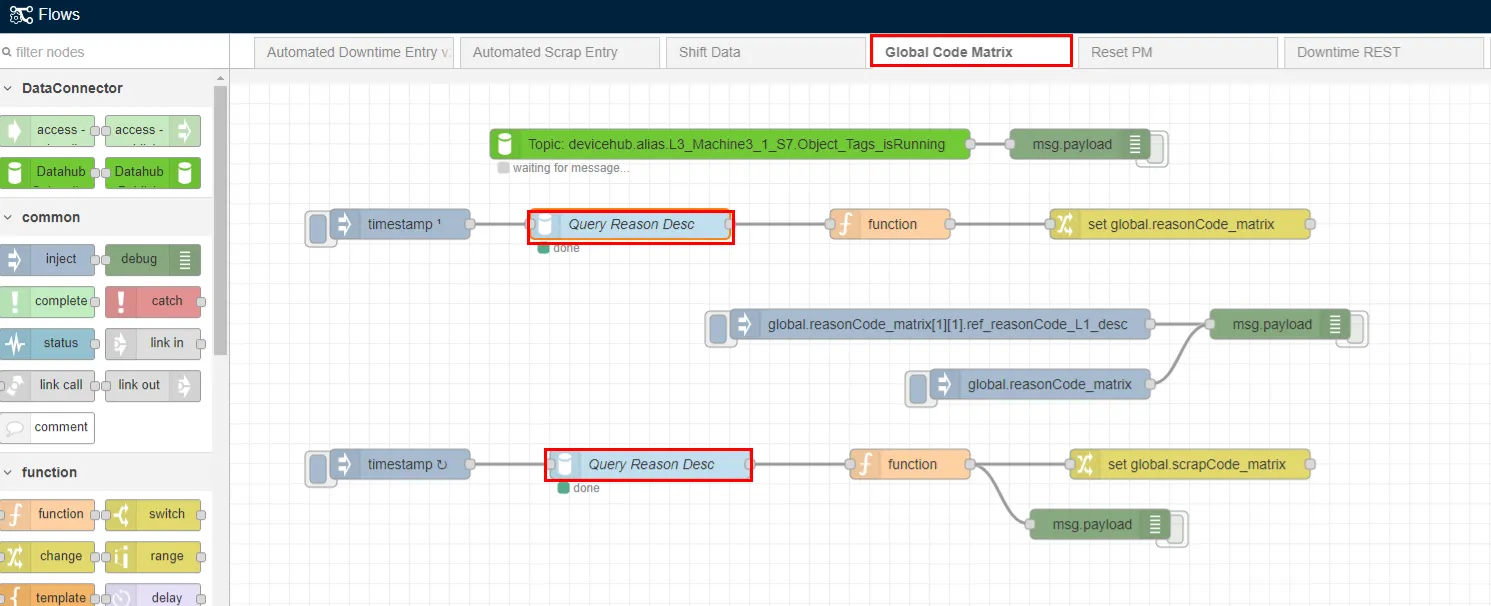
- Go to Flows > 1. production.
- Choose “Global Code Matrix” tab and double click the “Query Reason Desc” node.
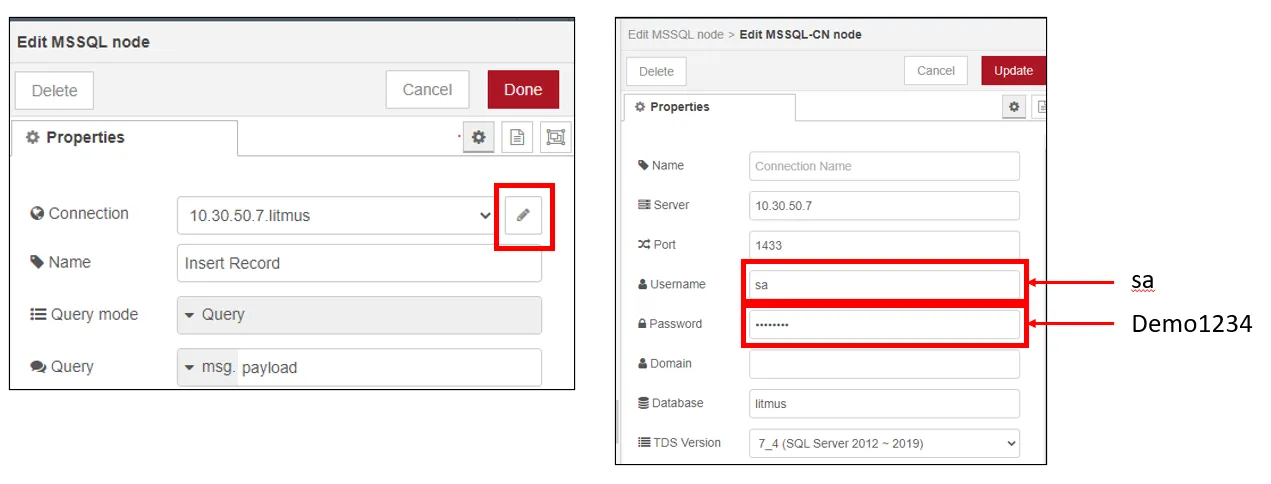
- Click on the pencil icon.
- Add the Username and Password (shown below).
- Click Update.
- This username and password will need to be performed in the following nodes:
- Flows Manager > 3. Startup and Maintenance > "Clear Old Records" tab > MSSQL-PLUS node.
- Flows Manager > 4. Energy Monitoring, CBM and CDM > "Scheduled Work Order" tab > MSSQL-PLUS node.
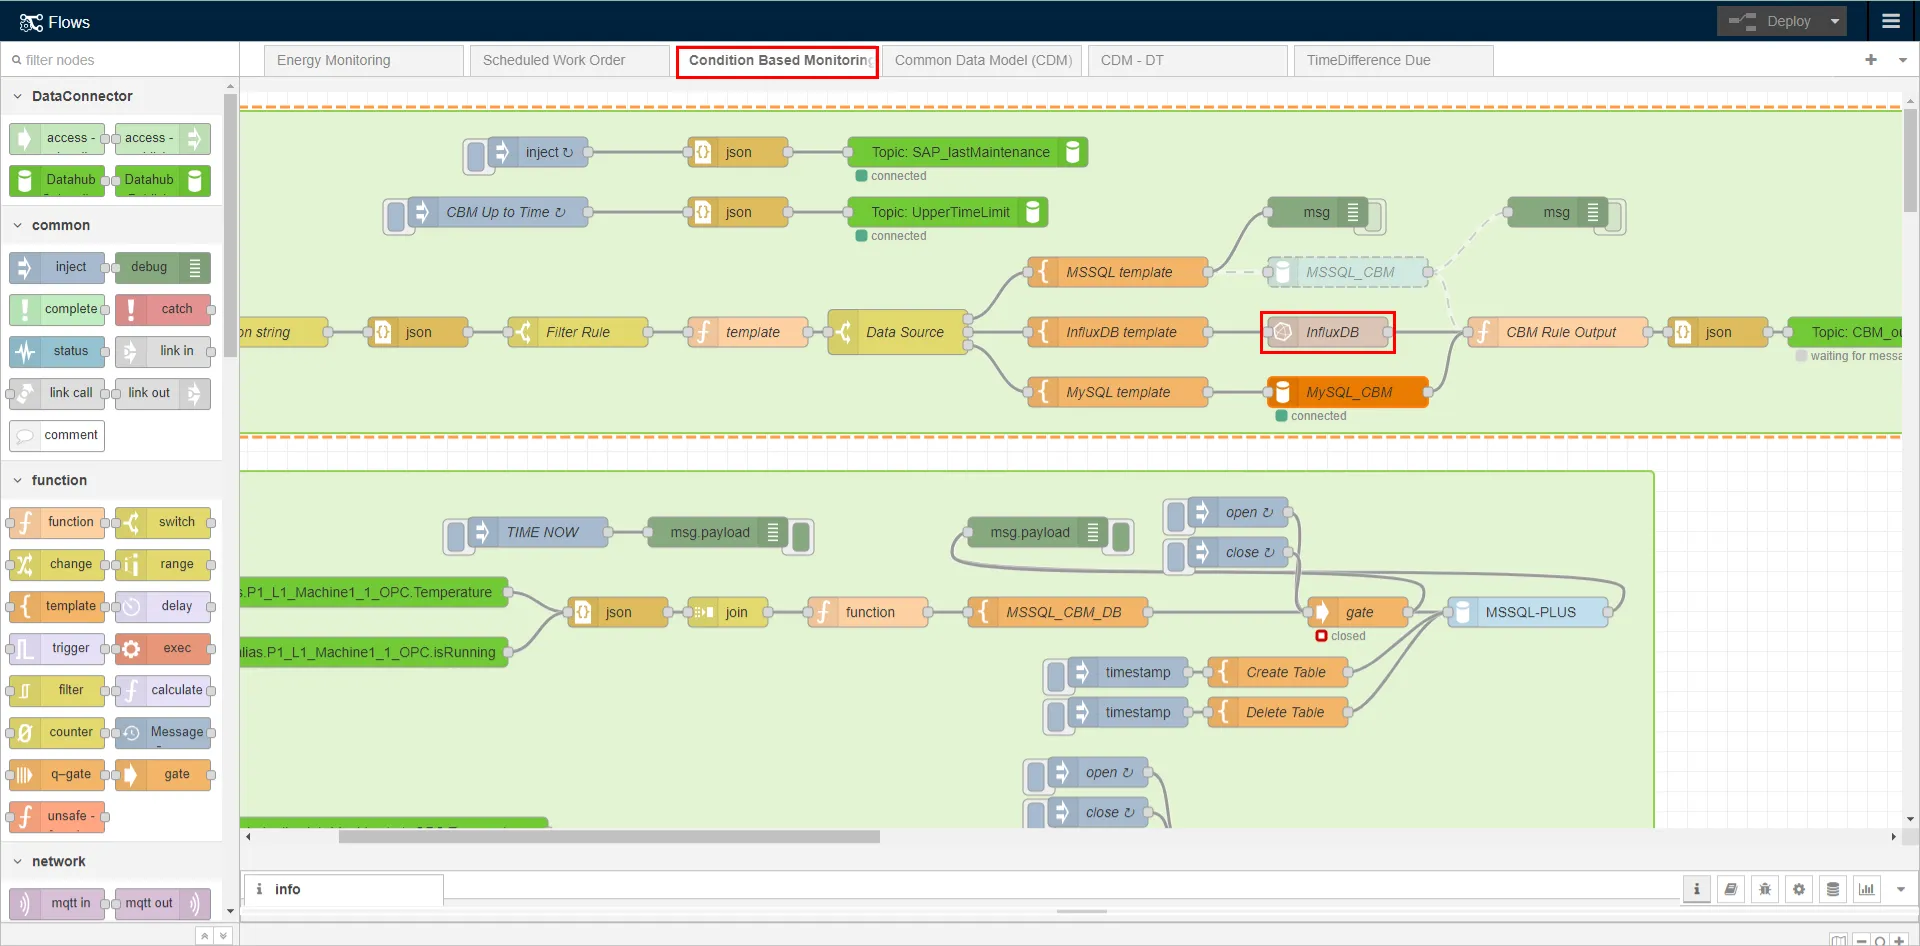
- Flows Manager > 4. Energy Monitoring, CBM and CDM > "Condition Based Monitoring (CBM)" tab > MySQL_CBM node.
- Note: Make sure you “Deploy” the changes in Flows
- Lastly, you will need to add a user to the internal LE database tsdata. To add the user, go to DataHub > DB Users and press the "+" button.
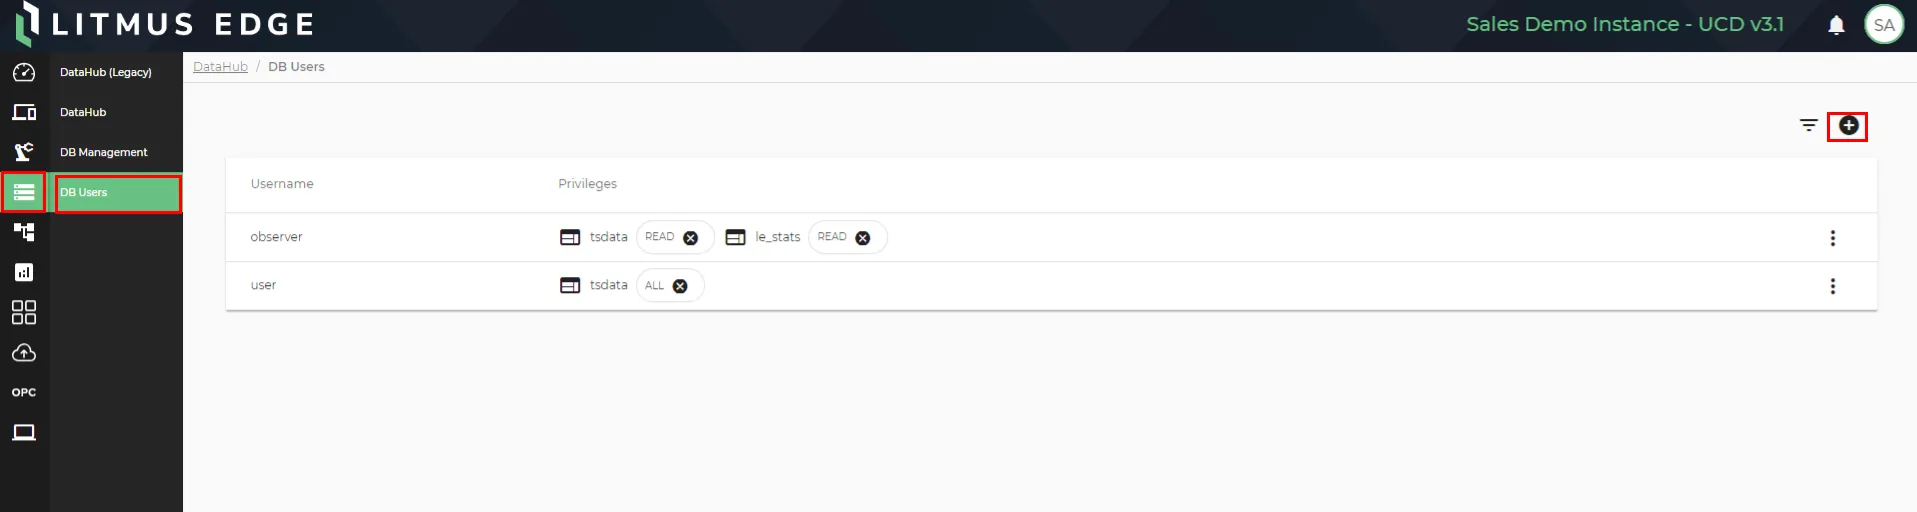
- Add the user created in step above to the Flows Manager > 4. Energy Monitoring, CBM and CDM > InfluxDB node.
Access Grafana
- Browse to the IP address of the Litmus Edge and add “:3000” to the URL.
- Login to Grafana using admin/admin.
- Change the password (or skip).