Visualizing Litmus Edge Manager Prometheus Metrics with Grafana
Overview
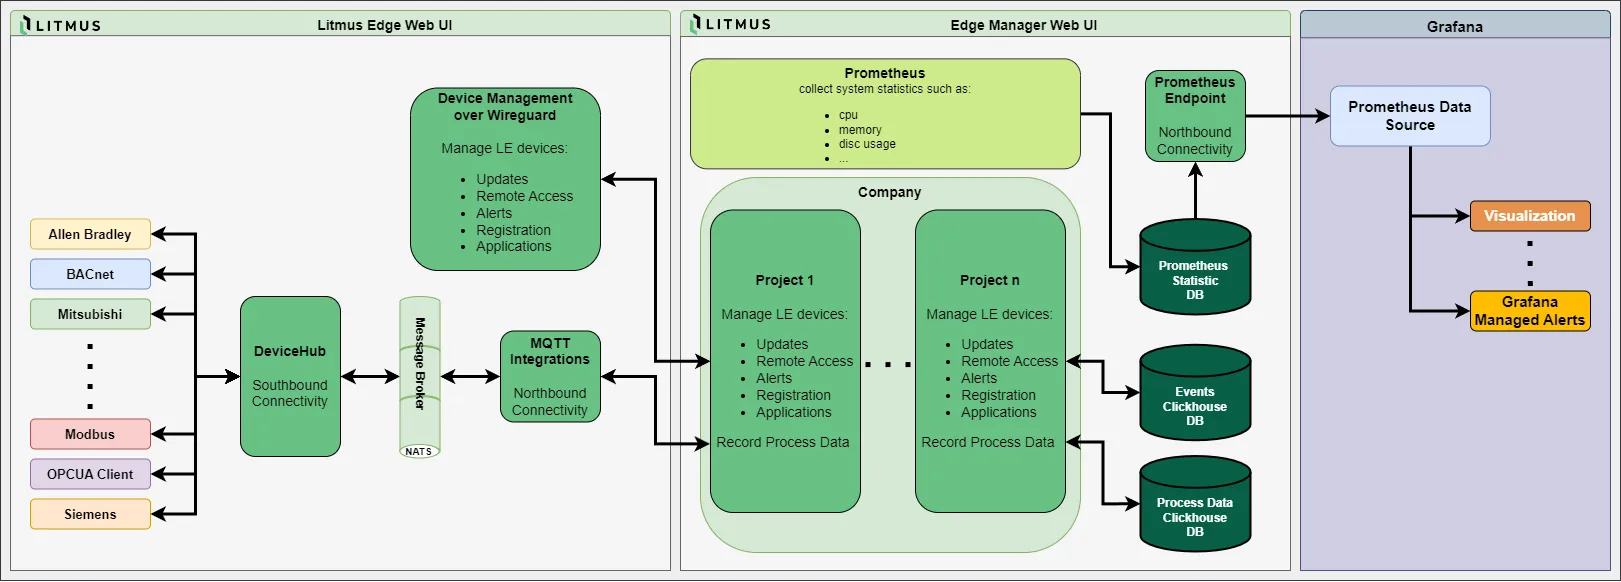
Litmus Edge Manager (LEM) 2.31.x and later runs its own Prometheus server, which collects LEM system metrics such as CPU, memory and disk usage. When you turn on the Prometheus endpoint, LEM exposes that server on port 9090, and Grafana can query it as a Prometheus data source.
Data flow: Grafana queries the LEM Prometheus URL, http://<LEM IP address>:9090. LEM collects and stores the metrics; Grafana only reads them.
Scope: this guide assumes LEM and Grafana are already installed and running. Self-hosted Grafana, Grafana Cloud and Grafana Enterprise all work. It does not cover installing Grafana or designing dashboards. LEM projects also include their own Grafana dashboards; this guide is for bringing LEM metrics into your own Grafana.
Key facts
Item | Value |
|---|---|
What LEM exposes | Its built-in Prometheus server, with LEM system metrics such as CPU, memory and disk |
Minimum LEM version | 2.31.x |
Direction | Grafana queries LEM |
Endpoint | http://<LEM IP address>:9090, shown as the Prometheus URL in LEM |
Network requirement | Grafana must reach LEM on inbound TCP port 9090 |
Where to configure LEM | LEM Admin Console at https://<LEM IP address>:8446, then Integration, then Prometheus |
Grafana data source type | Prometheus |
Built-in alternative | LEM projects include their own Grafana dashboards |
Sources: LEM Prometheus, LEM 3.0.x API: Integration.
Before you begin
Confirm all of these before starting:
- LEM 2.31.x or later is running, and you can log in to the LEM Admin Console as an administrator.
- Grafana is running, and your Grafana user can add data sources. By default that takes the organization admin role.
- Grafana can reach LEM on TCP port 9090. Open that port in LEM's firewall and any network firewalls in between, and limit the rule to your Grafana hosts where you can.
- With Grafana Cloud, LEM usually sits on a private network that Grafana Cloud cannot reach directly. Plan a network path first, such as Grafana's private data source connect.
Collect these values as you go:
Value | Where it comes from | Where it is used |
|---|---|---|
LEM IP address | Your LEM installation | LEM Admin Console URL; firewall rule for port 9090 |
Prometheus URL | LEM Prometheus pane, after you turn on the endpoint | Grafana Prometheus data source, Prometheus server URL field |
Grafana address and login | Your Grafana installation | Signing in to add the data source |
Part 1: Turn on the Prometheus endpoint in LEM
- Open https://<LEM IP address>:8446 and log in to the LEM Admin Console.
- In the navigation panel, select Integration. The Kafka pane opens by default.
- In the Integration sub-panel, select Prometheus.
- Turn on the Prometheus endpoint toggle.
- Save the change.
- Copy the Prometheus URL shown on the pane, for example http://10.0.0.20:9090.
The Alert Manager Address field on the same pane is for alert forwarding and is not needed here. See Litmus Edge Manager alert monitoring with Prometheus Alertmanager.
Part 2: Connect Grafana to the LEM metrics
You need the Prometheus URL from Part 1.
- In Grafana, open Connections > Data sources and click Add new data source. Older Grafana versions use Configuration > Data sources.
- Select Prometheus.
- Give the data source a clear name, for example LEM Prometheus.
- In Prometheus server URL, paste the Prometheus URL from Part 1. Older Grafana versions label this field URL.
- With Grafana Cloud, select your private data source connection in the data source settings.
- Leave the other settings at their defaults and click Save & test. Grafana reports that it successfully queried the Prometheus API.
The data source can now be used in any dashboard.
Part 3: Verify that metrics arrive
A successful Save & test means Grafana can reach LEM. To confirm metrics actually come back, run a query.
- In Grafana, open Explore and select the LEM data source.
- Run the query up. Each series returned is a target the LEM Prometheus server collects from; the value 1 means the target is reachable.
- Open the metric list in the query editor to browse the available LEM metrics.
Add a metric to a dashboard
- Create a new dashboard and add a visualization.
- Select the LEM data source.
- In the query editor, choose a metric from the metric list, for example a CPU or memory metric, and run the query.
- Save the dashboard.
This guide does not cover dashboard design. See the Grafana documentation for building dashboards.
Troubleshooting
Symptom | Likely cause | What to check |
|---|---|---|
Save & test fails with a timeout or connection refused | Endpoint off, port 9090 blocked, or wrong URL | The Prometheus endpoint toggle is on and saved. The URL matches the one shown in LEM. From the Grafana host, curl "http://<LEM IP address>:9090/api/v1/query?query=up" returns "status":"success". Firewalls allow TCP 9090 from Grafana. |
Save & test fails in Grafana Cloud | Grafana Cloud cannot reach a private LEM address | A private data source connection is set up and selected in the data source settings. |
Save & test succeeds, but panels show no data | Time range or metric name | Run up in Explore with the time range set to the last hour. Pick metric names from the metric list instead of typing them. |
Dashboards that worked now show no data | Endpoint turned off, LEM IP address changed, or a new firewall rule | The toggle is still on, the data source URL still matches the Prometheus URL in LEM, and port 9090 is still open. |
Remove the integration
Remove the Grafana side first, so no dashboard is left pointing at an endpoint that no longer answers.
Clean up Grafana
- Delete the dashboards or panels that use the LEM data source, or point them at another data source.
- Open Connections > Data sources, select the LEM data source, and delete it.
Turn off the endpoint in LEM
Other tools may use the same endpoint, such as a second Grafana instance. Before turning it off, check that nothing else still queries it. Alert forwarding to Alertmanager does not use the endpoint, so turning it off does not affect alerts.
- In the LEM Admin Console, open Integration > Prometheus.
- Turn off the Prometheus endpoint toggle and save the change.
- If you opened port 9090 only for Grafana, remove that firewall rule as well.
Common questions
Do I need my own Grafana to see LEM metrics?
No. LEM projects include Grafana dashboards, opened from Features > Grafana Dashboards in a project. Use this guide to bring LEM metrics into a Grafana you already run.
Which metrics are available?
LEM system metrics such as CPU, memory and disk usage. Browse the full list in the metric list of Grafana's query editor.
Does this work with Grafana Cloud or Grafana Enterprise?
Yes. Any Grafana that supports the Prometheus data source works. Grafana Cloud also needs a network path to LEM's port 9090, such as Grafana's private data source connect.
Can I use a tool other than Grafana?
Yes. Any tool that can query the Prometheus API can read the endpoint.
Which port does LEM use for the endpoint?
TCP port 9090, inbound on LEM. The Prometheus URL in LEM shows the exact address.
Does alert forwarding to Alertmanager need this endpoint?
No. Alert forwarding works without the Prometheus endpoint. See Litmus Edge Manager alert monitoring with Prometheus Alertmanager.
Which LEM versions support this?
LEM 2.31.x and later.