Create and manage workspaces
Analytics workspaces serve as containers for analytics flows. A workspace can contain a single flow or multiple flows, typically related to each other in some way.
Create flow workspaces
You create flow workspaces in Analytics > Instances.
To create a flow workspace:
- Navigate to Analytics > Instances. The Instances pane appears.
- Click Create workspace. The Create workspace dialog box appears.
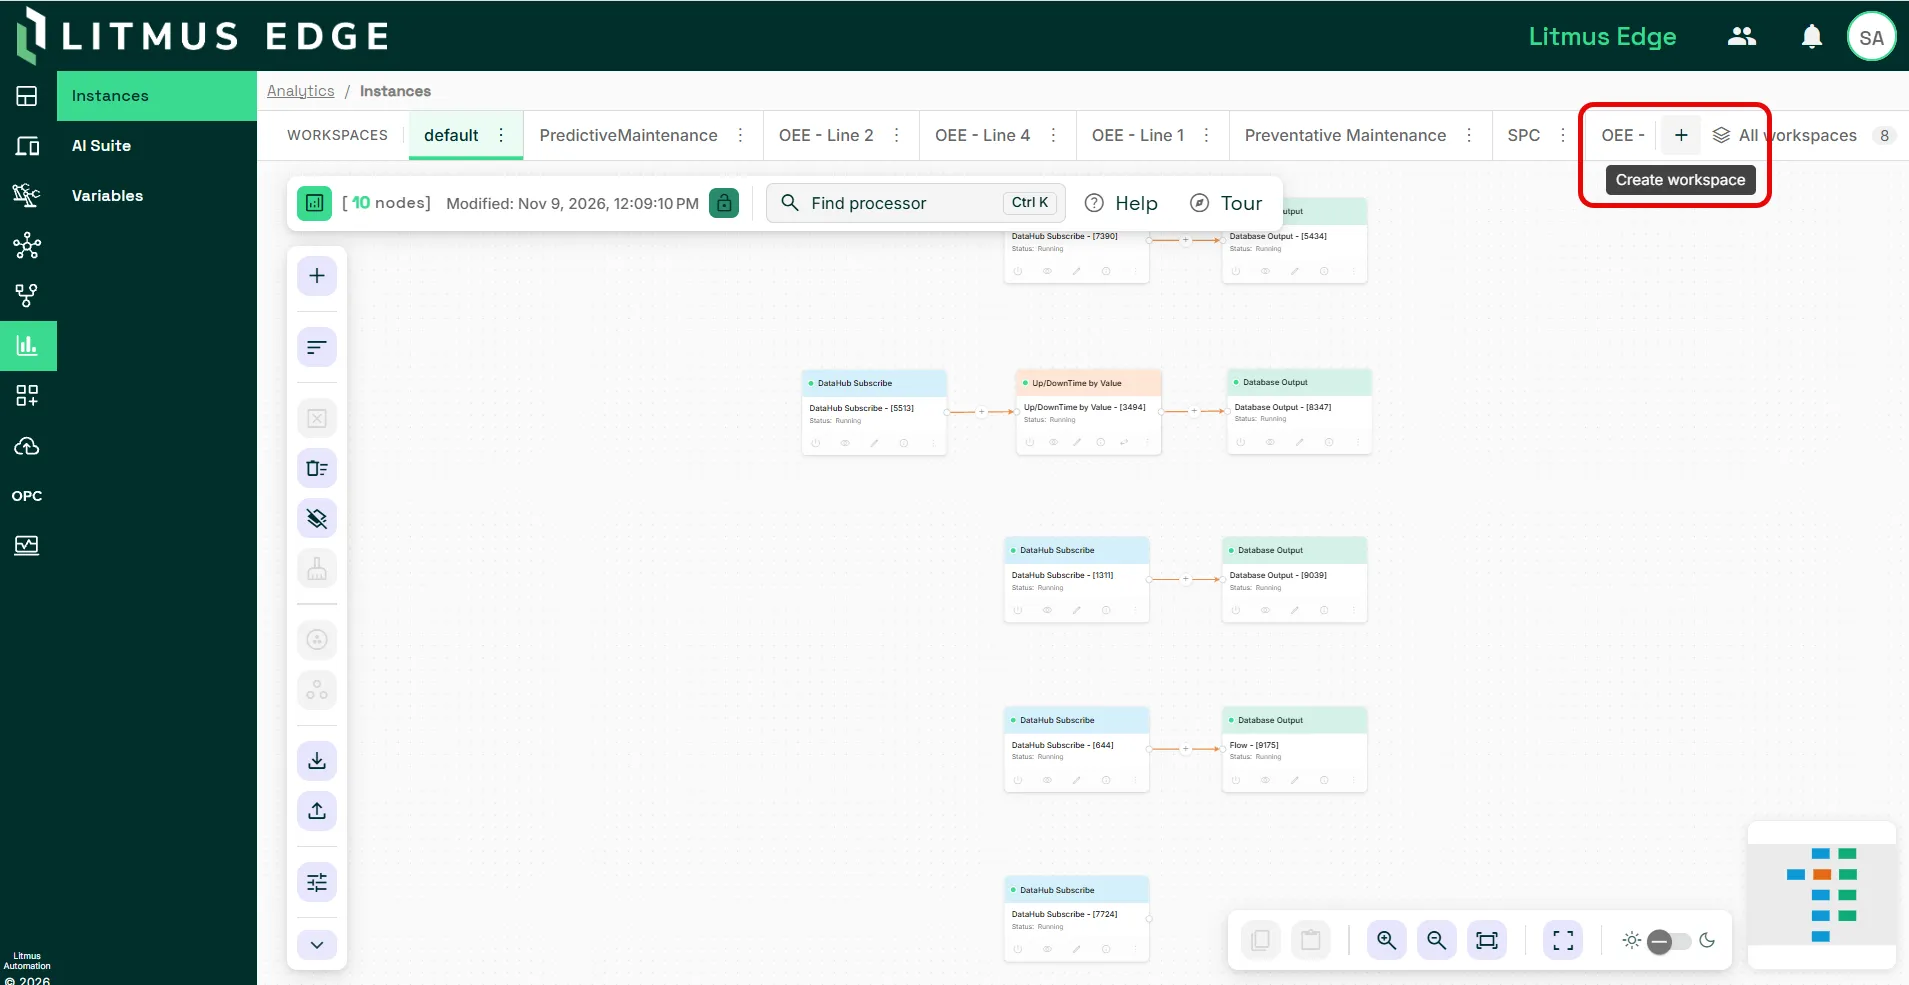
- Enter a workspace name.
- Click the Create workspace check mark.
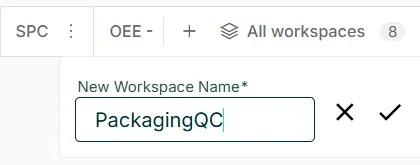
You can now select the workspace from the top toolbar.
Manage flow workspaces
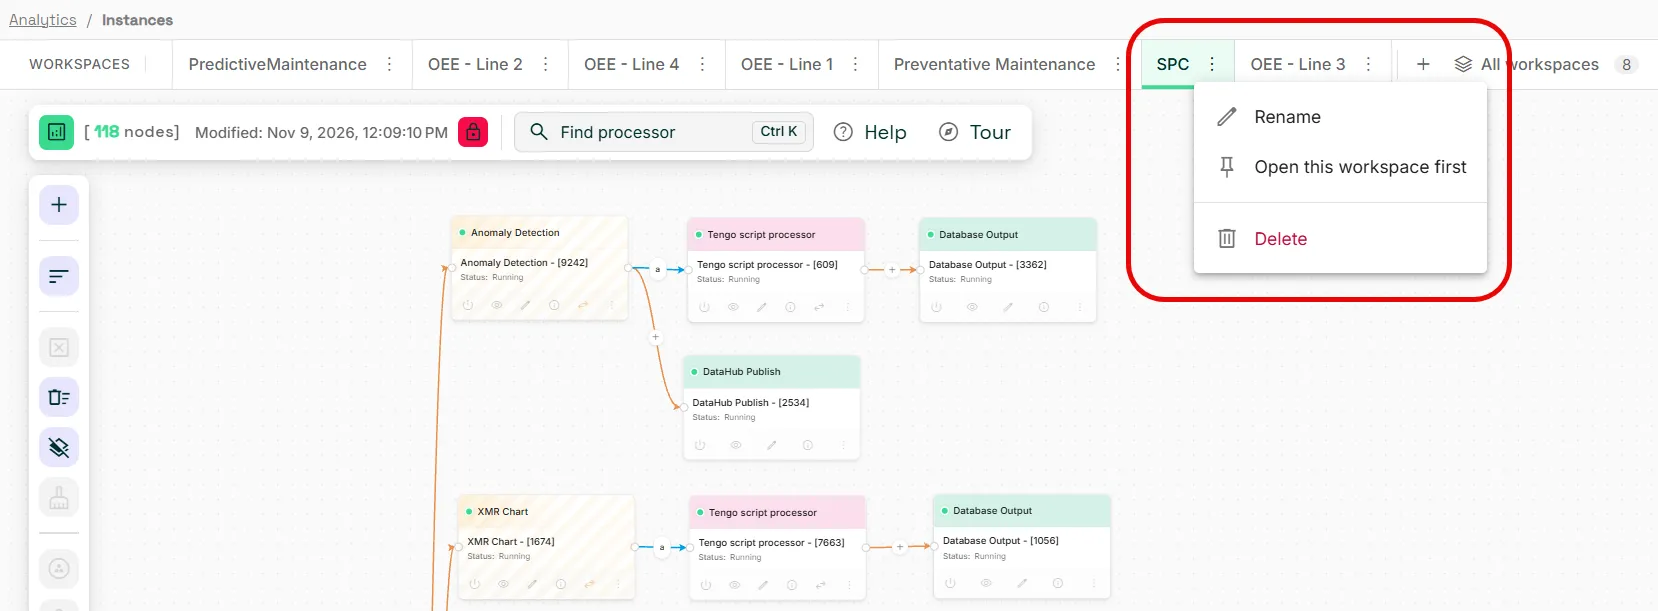
To manage a workspace, select Analytics > Instances. You can do the following:
- Rename: Modify the workspace name.
- Open this workspace first: Pin a workspace so that it becomes the default workspace.
- Delete: Delete the workspace.
Analytics canvas options
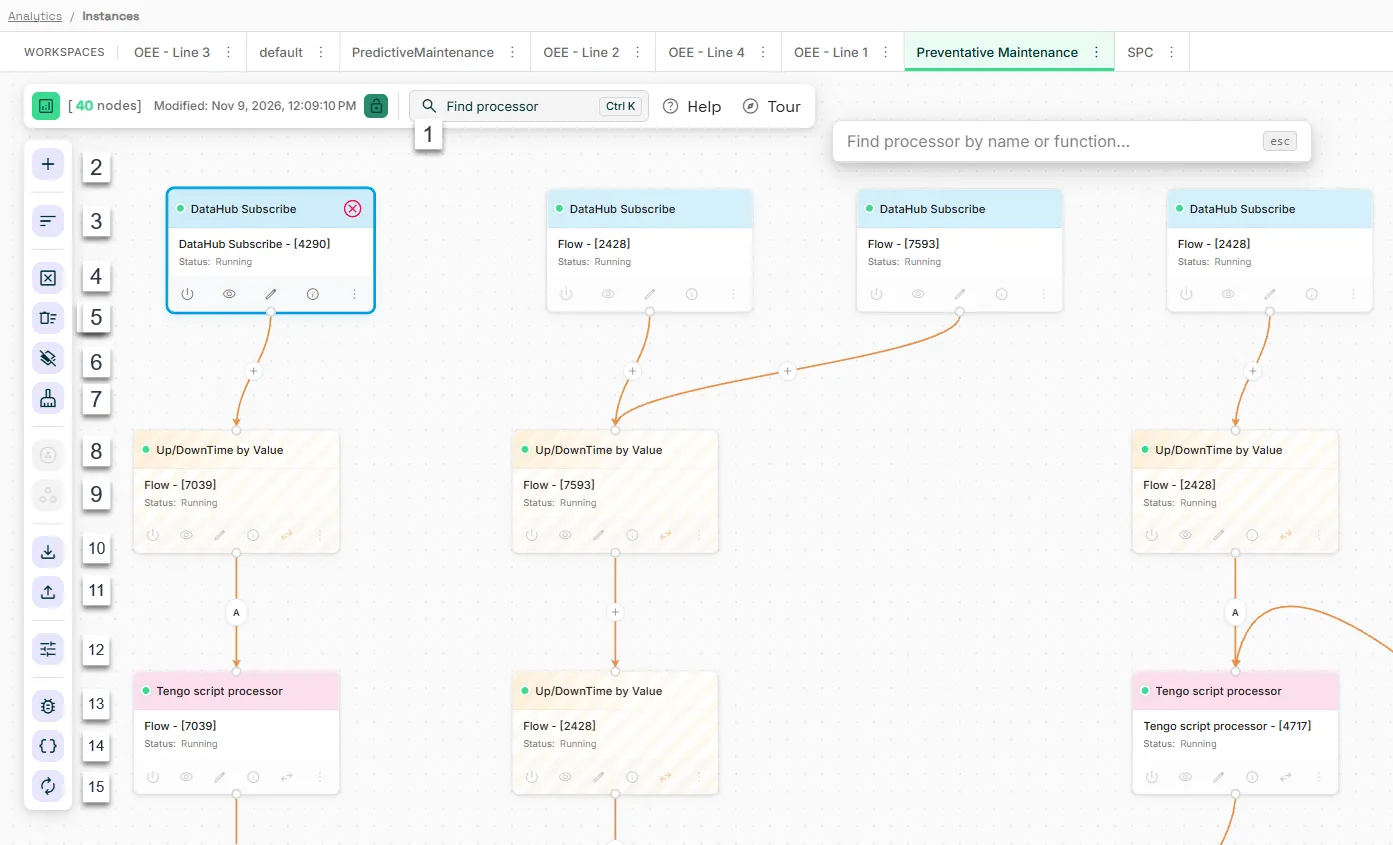
The Analytics canvas toolbar has options for finding, adding, arranging, grouping, and deleting processors, and for importing, exporting, and debugging flows.
Action | Details |
|---|---|
[1] Find processor | Type text to search by processor name or type. |
[2] Add processor | Opens the Processor pane. See Add processors and processor connections. |
[3] Rearrange | Adjusts the layout and position of processors on the canvas. |
[4] Delete selected | Deletes the selected nodes and their connections. |
[5] Delete All | Deletes all processor instances and groups in every workspace. This action can't be undone. |
[6] Clear Workspace | Deletes all processor instances and groups in the current workspace. |
[7] Remove Flow | Deletes the instance and all chained instances in a flow. |
[8] Group selected nodes | Opens the New Group Name dialog where you can create a group. |
[9] Ungroup selected nodes | Removes a group. |
[10] Export | Opens the Export Configuration dialog where you can export all processor groups or the selected ones. |
[11] Import | Opens the Import Configuration dialog where you can import an analytics flow from a JSON file. |
[12] Canvas Settings | Opens the Canvas Settings dialog. Here you can:
|
[13] Debug | Displays the debug panel. Click View processor output on an input or function processor to view its live output. The debug panel can't display output from output processors because output processors publish data as soon as they receive it. After it’s published, the data is no longer available in the UI. |
[14] Variables | Opens the Variables dialog where you can view variables and their values. |
[15] Refresh | Refreshes all analytics flows in the selected processor group. |
Processor and flow options
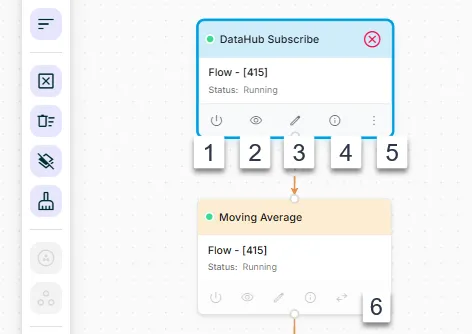
Each processor has its own controls. Use them to turn the processor on or off, watch its output while the flow runs, edit its settings, or copy or remove the processor or its whole flow.
Action | Details |
|---|---|
[1] Activate or deactivate processor | Activates or deactivates the selected processor. |
[2] Watch output | Opens the Instance Message pane where you can view processor output. |
[3] Edit processor | Opens the edit dialog for the processor. |
[4] Overview | Displays the status and ID of the processor. |
[5] Processor menu | Opens additional options (varies by processor type):
|
[6] Enable passthrough | Joins the processor's input message with its output, so downstream processors receive the original input fields along with the processor result. |