Define DataHub Queries
8 min
You can define a database query from your Litmus Add-ins in a structured, sequential way. The process resembles the syntax familiar to queries in dashboard tools like Grafana and executes within an Excel-integrated query.
Before You Begin
- Ensure at least one DataHub connection is already created. See Define DataHub Connections for details.
- Confirm that your selected database includes the necessary measurements (tables). See Configure an External DataHub Source to learn more.
Step 1: Navigate to Query Management Form
- Open a new Excel file with Litmus Excel Add-ins enabled. See Step 4: Verify Litmus Excel Add-in Activation in Excel to learn more.
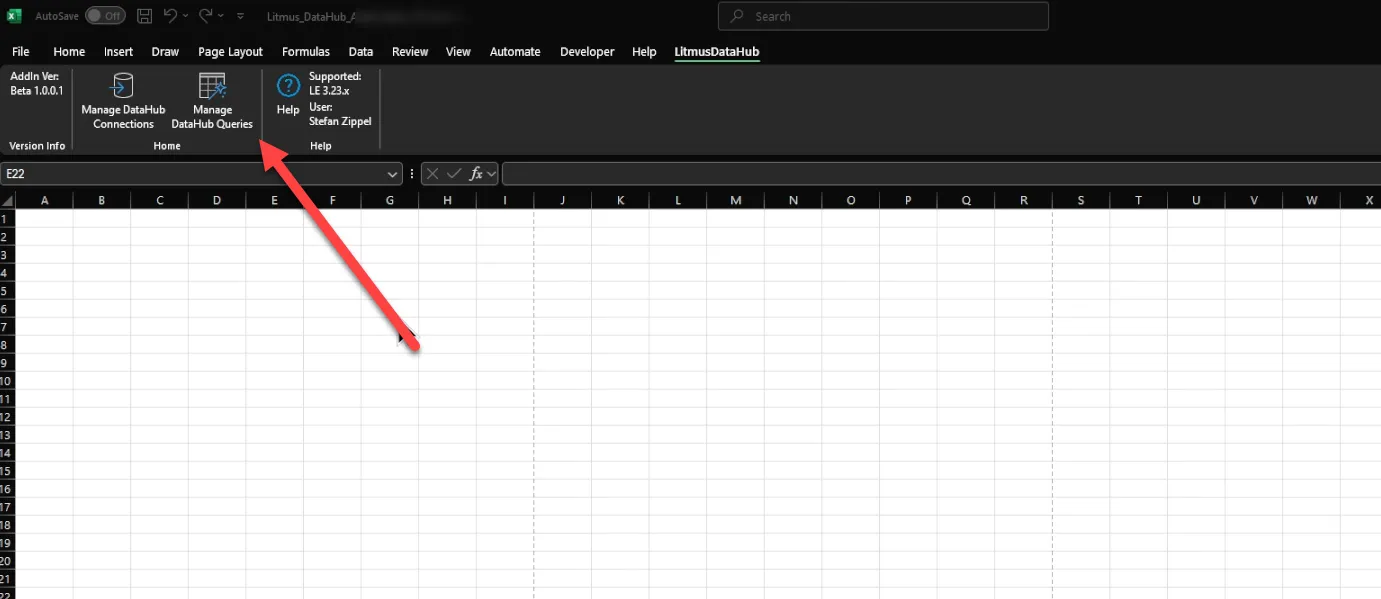
- Click on Manage DataHub Queries.
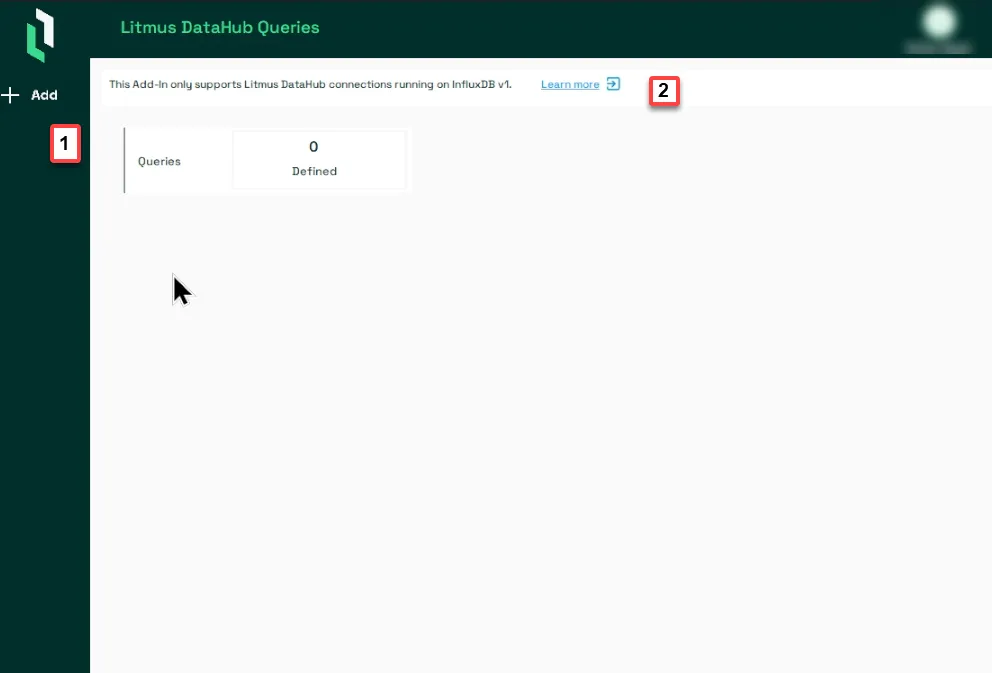
- The Litmus DataHub Queries window pops up. You can take the following actions from this page:
- Add a New Queries: See Step 2 (Next Step) below for detailed steps.
- Learn more: This Add-in only supports Queries using InfluxDB v1. You can access the InfluxDB Documentation through this link.
Step 2: Add a New Query
Note: Verify the visibility of the Add button, which indicates readiness for query creation. If the Add button isn't visible, check the Define DataHub Connections guide.
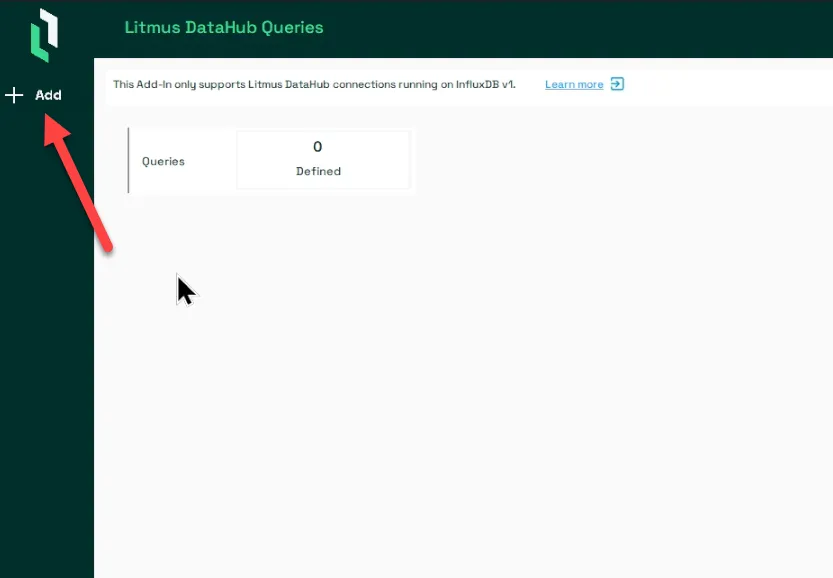
- Click the Add button to begin the process.
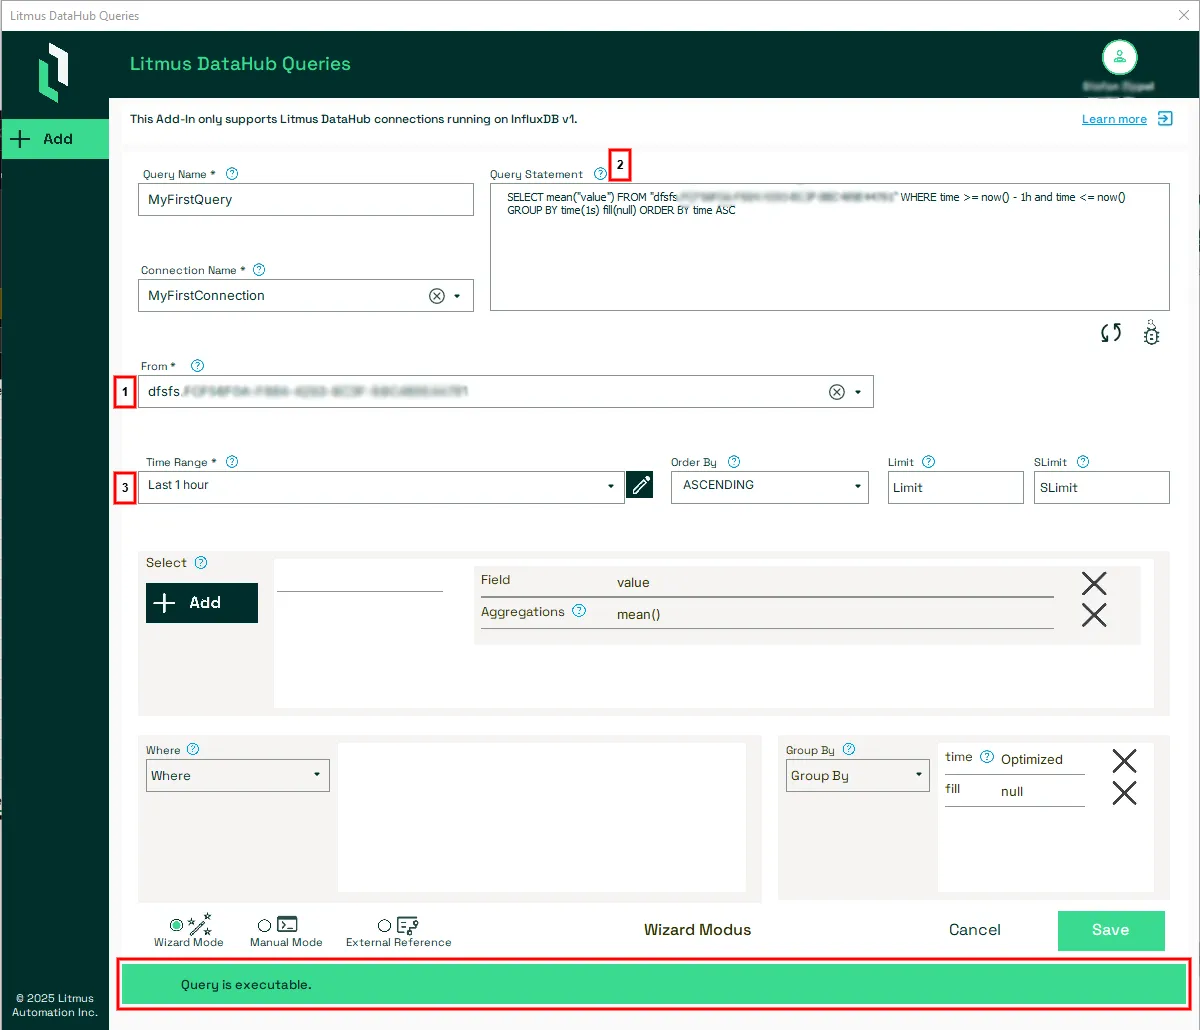
- The system will prompt for a query name and connection selection.
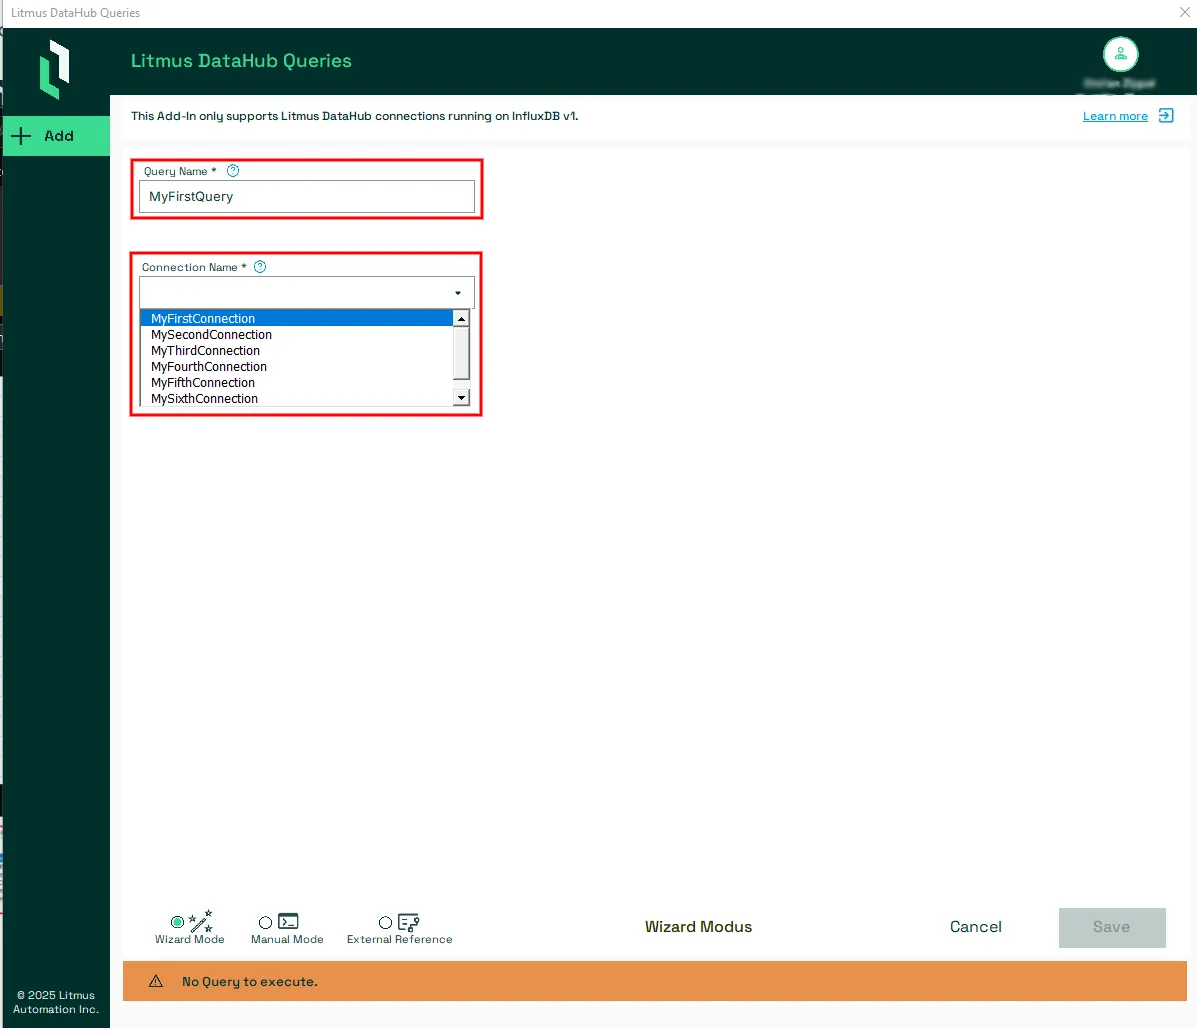
- Query Name: The tool auto-generates a default query name that includes the creation date and time. (Optionally) Modify the default name to align with your internal naming standards.
- Connection Name: Choose the appropriate connection from the drop-down menu. See Define DataHub Connections if you don't see any defined connection.
Note:
By default, the Query definition tool is always in Wizard Mode.

Step 3: Configure Query Parameters
Configure the following fields:
- From: Pick the desired table (from the drop-down menu) for the query.
- Query Statement: It displays only the query that the user configures using all the other tools.
- Time Range, Order By, Limit, SLimit, Select, Where: The system constructs a default query that:
- Applies a mean calculation on the selected field.
- Groups results by time.
- Orders data in ascending order.
- Note: The default time range is set to the last hour.
- If the query syntax is correct, you will see the message "Query is executable." in green at the bottom.
Step 4: Preview the Query Results
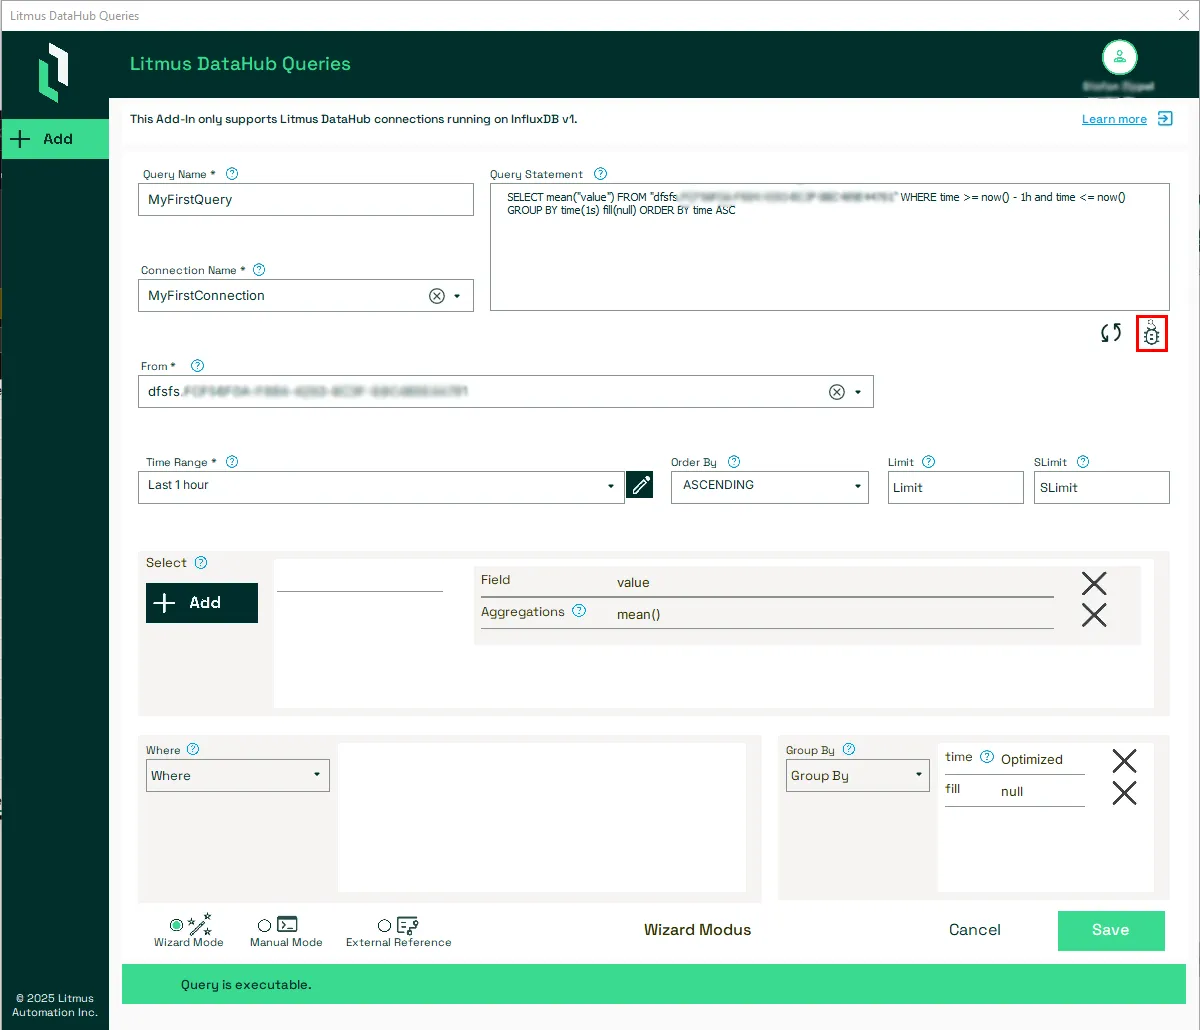
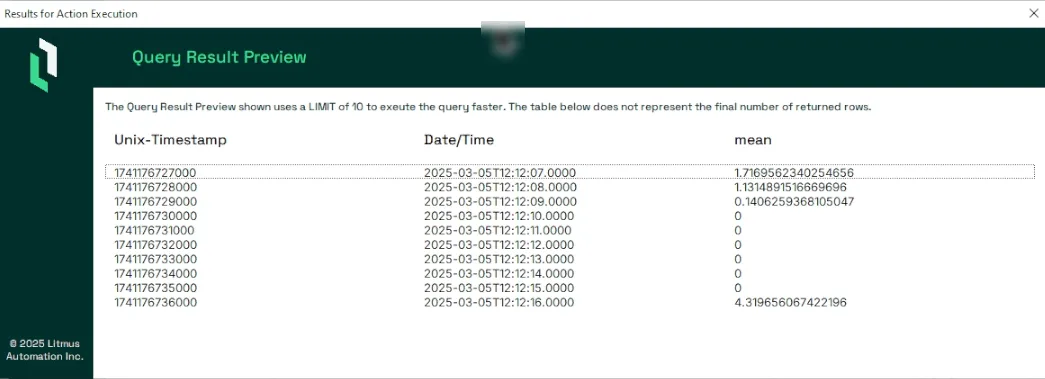
- Use the preview icon to display the first 10 rows of query results. The Results for Action Execution window appears.
- The preview serves as an initial data check.
Troubleshooting: A lack of data may indicate:
- An incorrect query configuration.
- A combination of conditions that returns no data.
- No data available within the selected time range.
Step 5: Save and Finalize the Query
- After validating the query setup, click Save to save the query.
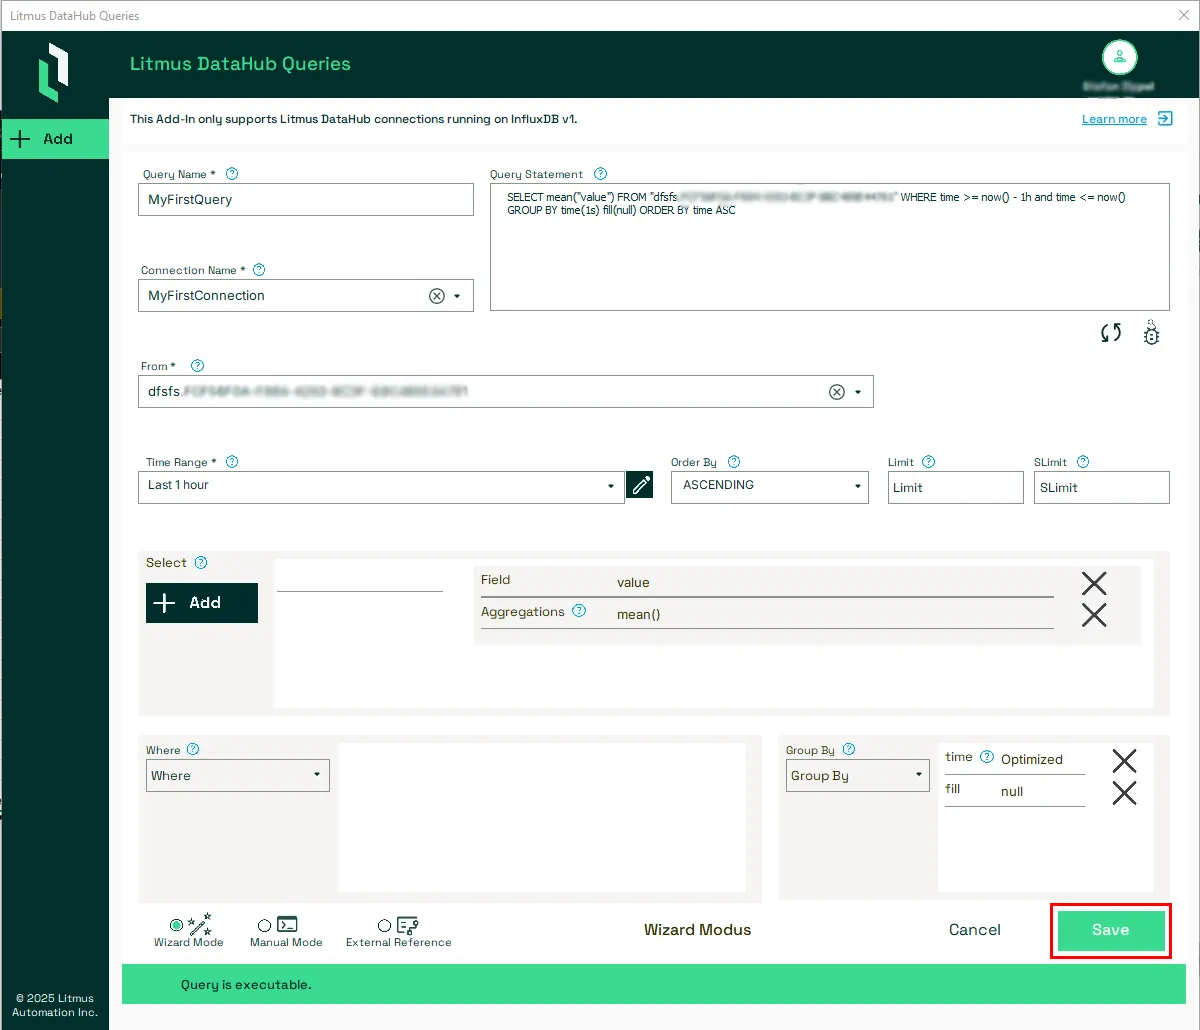
- When saved, a new Excel sheet with query details is added, and the dashboard updates accordingly.
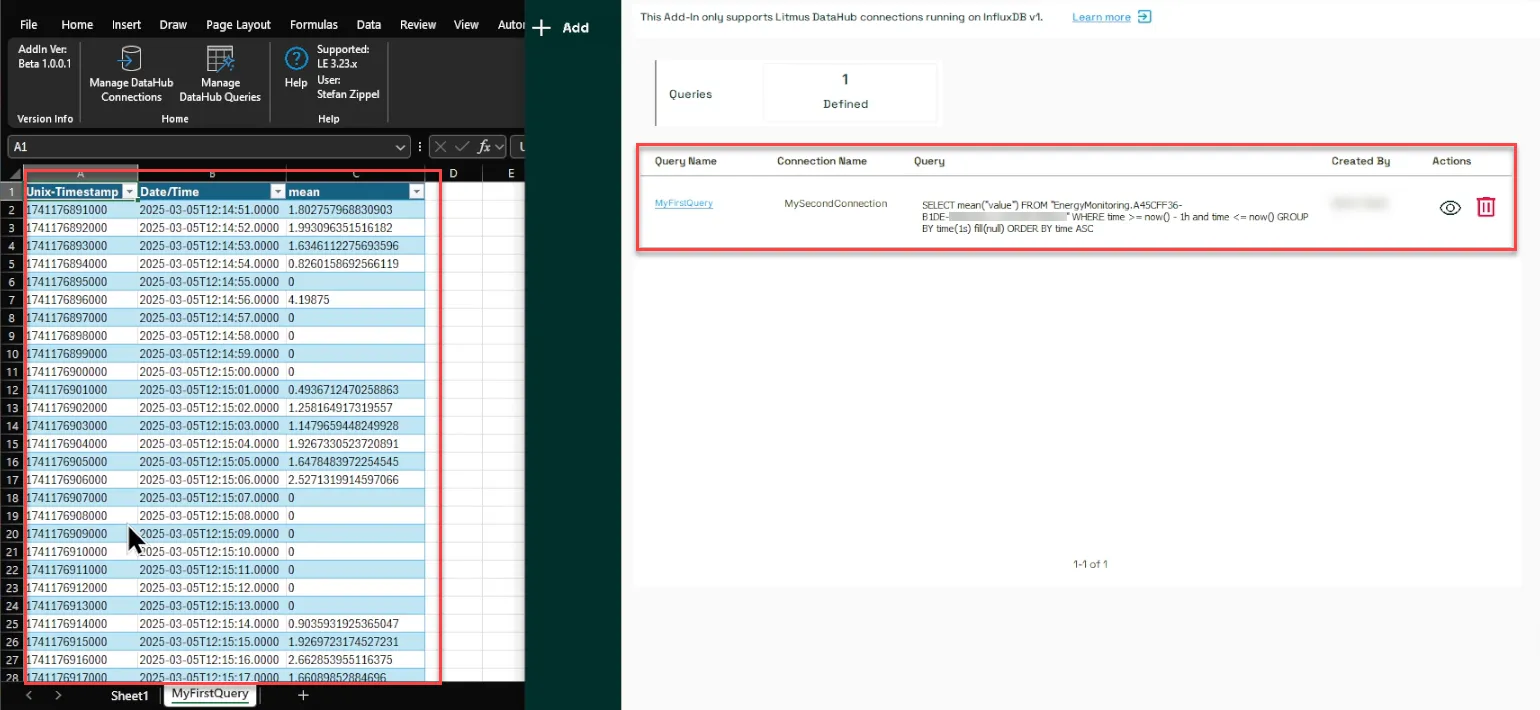
Note: The query remains functional independently of the DataHub add-in and can be refreshed directly via Excel’s data refresh option.