Dashboard
The Unify Dashboard provides real-time metrics about MQTT topics, messages, and clients. Backend cluster information is also provided for system health monitoring.
Dashboard Data
Once you connect to Unify, you can use the dashboard for monitoring.
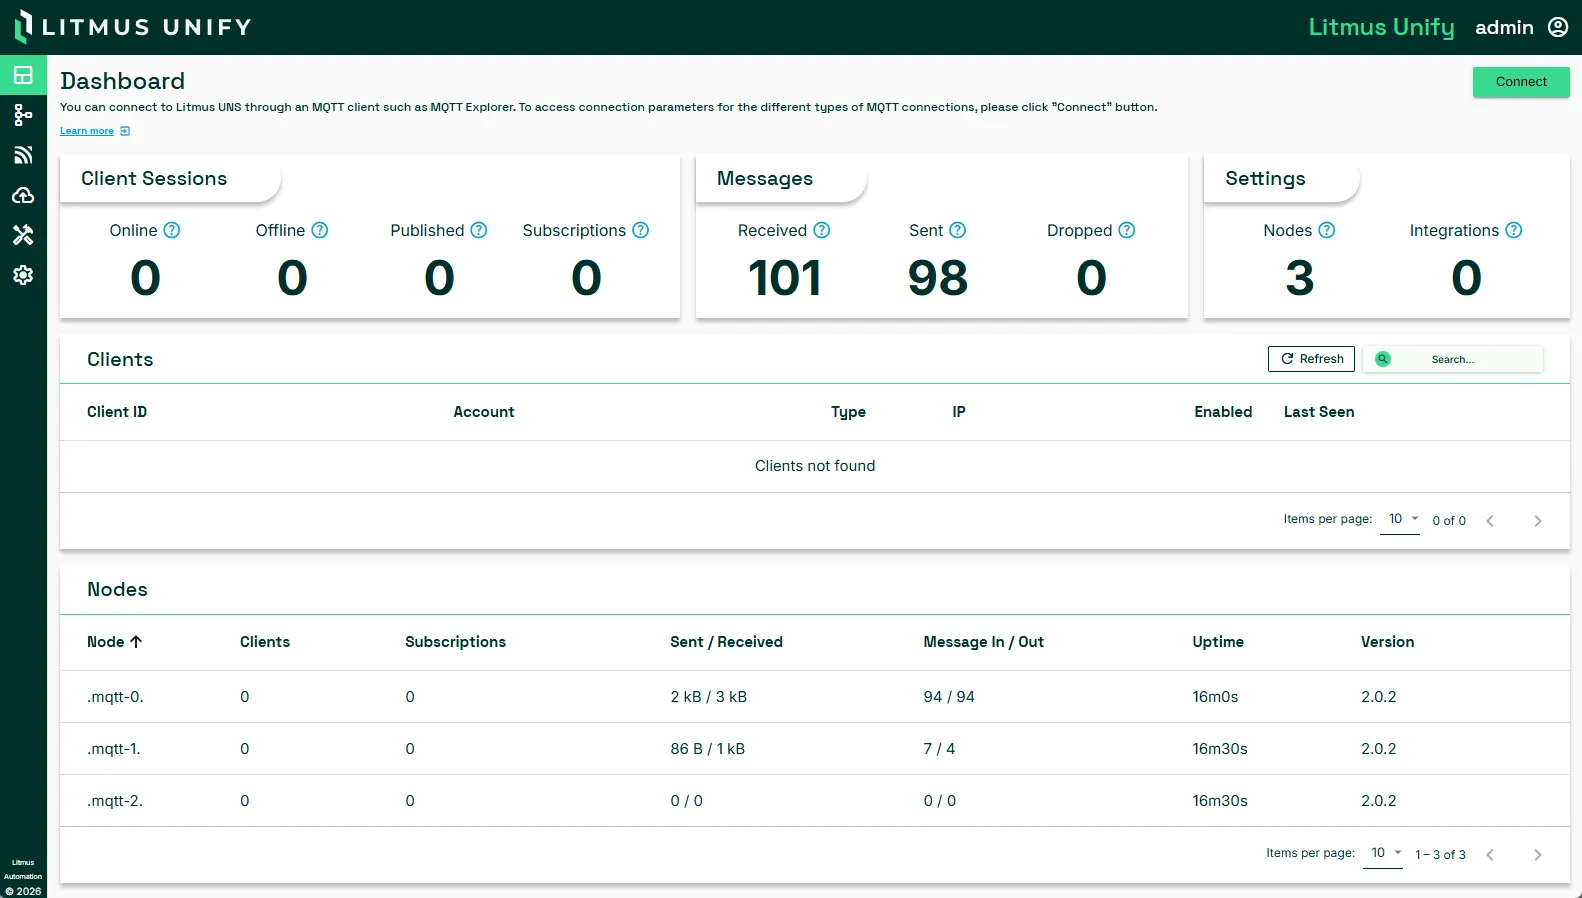
Section | Details |
|---|---|
Client Sessions | Monitor the real-time count of clients online or offline, published topics, and active subscriptions. |
Messages | Analyze the flow of messages with metrics on received, sent, and dropped messages. |
Settings | View the total count of nodes participating in the Unify network and integrations linked to Unify. |
Clients | View a list of clients with their client ID, account, type, IP address, status, and last seen timestamp. |
Nodes | View a list of connected server nodes, their client count, subscription count, data sent and received, messages in and out, uptime, and version. |